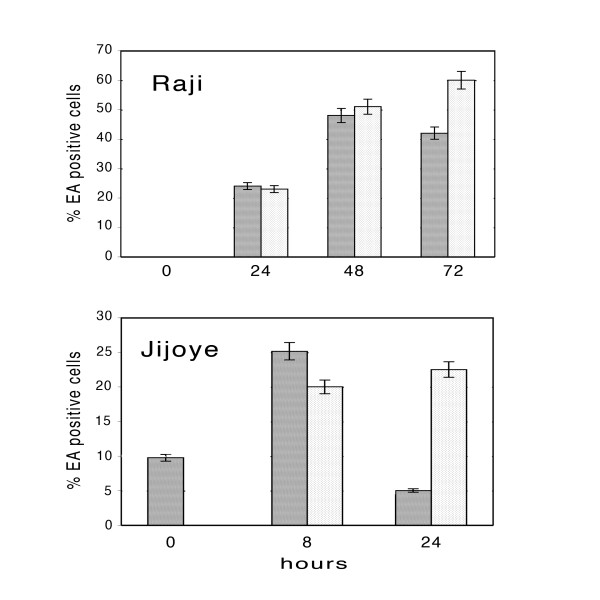
Figure 3.
Cytoflowrimetric analysis of EA expression in Raji and Jijoye cells. EBV lytic cycle was induced in Raji and Jijoye cells in the absence or in the presence of 3-ABA as described in the Methods. At the indicated times, cels were analyzed by flowcytometry after staining with FITC-EA antibodies. The bargraph represents the percentages of EA-positive cells determined after induction in the absence (dark bars) or in the presence (light bars) of 3-ABA. Error bars are the means ± SD of three independent experiments.

