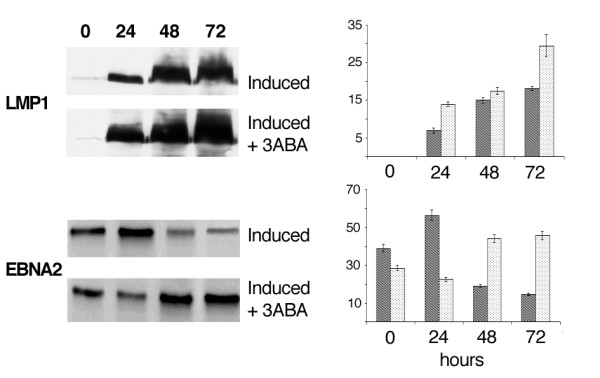
Figure 5.

LMP1 and EBNA2 expression by Western blot analysis. Cell lysates obtained from Raji cells treated and collected as reported in Fig.1, were subjected to SDS-PAGE. The blots were probed with LMP-1 and EBNA2 antibodies. Specific signals, quantified by densitometry are expressed as arbitrary units in the bargraph. Error bars are the means ± SD of three independent experiments. Dark bars: induced Raji cells; light bars: induced Raji cells + 3-ABA.
