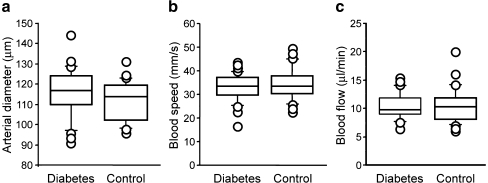
Fig. 1.
Retinal haemodynamic parameters in type 1 diabetic individuals and matched non-diabetic controls. The box plots present the data for the 27 diabetic and 26 control participants in whom the measurements could be performed at the major superior temporal artery. Each box plot shows the 10th, 25th, 50th (median), 75th and 90th percentiles of the indicated parameter. Values above the 90th and below the 10th percentile are plotted as points

