
Fig. 1.
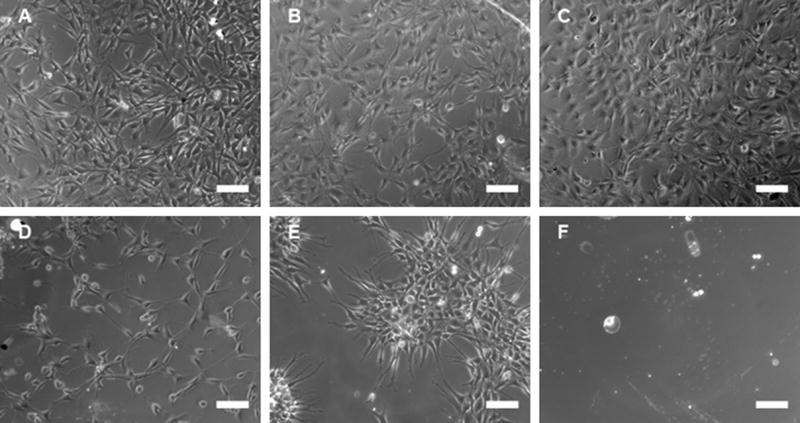
Cell adhesion on EG-containing SAMs. Images were captured 48 h after seeding cells on SAMs of (A) 0% EG/100% COO−, (B) 20% EG/80% COO−, (C) 40% EG/60% COO−, (D) 60% EG/40% COO−, (E) 80% EG/20% COO− and (F) 100% EG, all lacking immobilized DNA complexes. Scale bars correspond to 100 μm.