
Fig. 8.
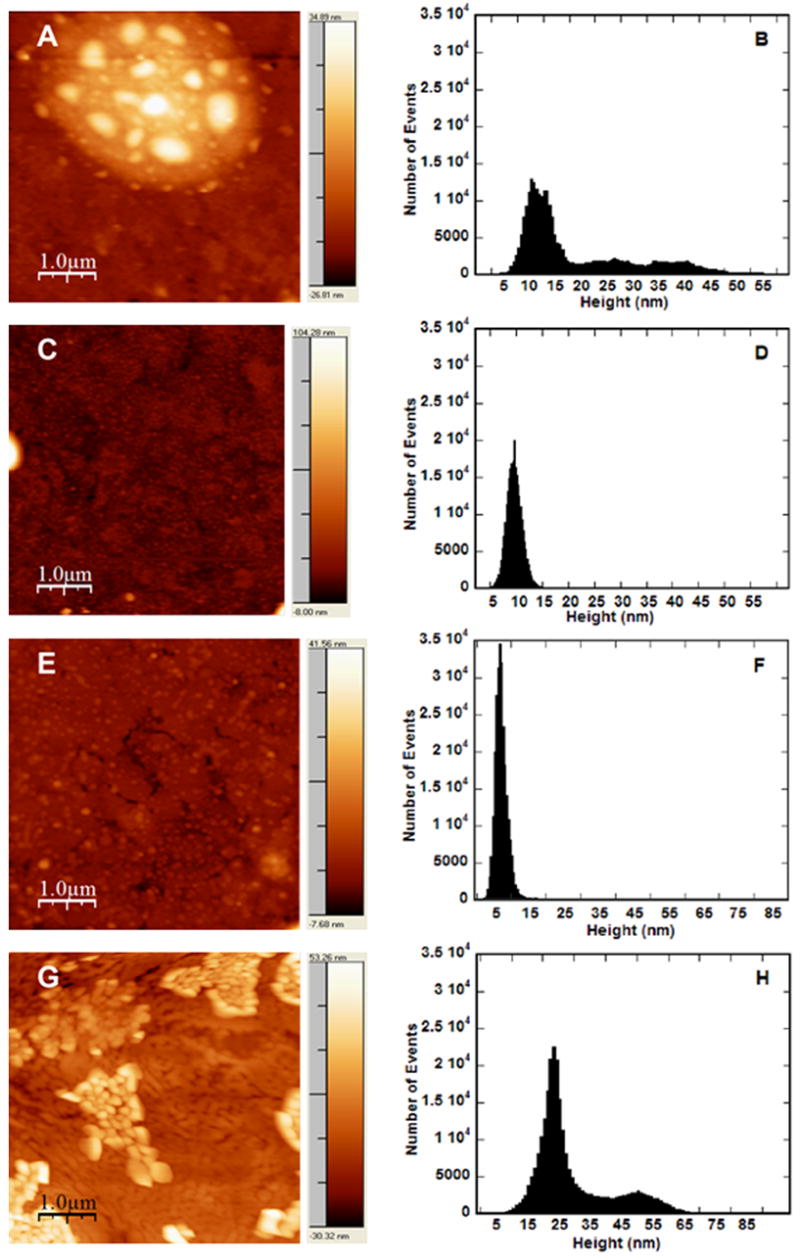
AFM images and analysis of complexes immobilized on SAMs. Complexes were formed at N/P of 10 (A–D) and N/P 25 (E–H) and immobilized on SAMs formed with 0% EG/100% COO− (A, B, E, F) or 40% EG/60% COO− (C, D, G, H). Pixel brightness in images (A, C, E, G) corresponds to particle height. Scale bars correspond to 1.0 μm. Height analysis histogram (B, D, F, H) reports analysis of image to left.