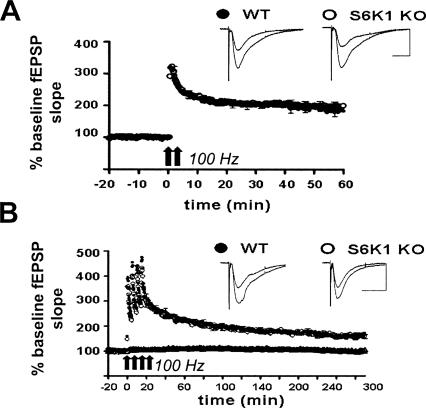
Figure 6.
L-LTP is normally expressed in S6K1 knockout mice. (A) L-LTP was elicited with 2 trains of 100 Hz (intertrain interval of 30 sec) and monitored 60 min after induction. No differences were observed in S6K1 knockout (KO) (open circles, n = 8 slices) and wild-type (WT) (solid circles, n = 13 slices). Scale bar, 200 msec, 0.5 mV. (B) Similarly, L-LTP evoked with 4 spaced trains of 100 Hz stimulation (intertrain interval of 5 min) revealed no observable differences up to 300 min after induction in S6K1 KO (open circles, n = 10 slices) and WT (solid circles, n = 10 slices). At the bottom of the panel, basal responses in S6K1 KO slices (open triangles, n = 10 slices) were comparable with WT (solid triangles, n = 10 slices) in unstimulated slices over a similar time course. Representative traces before and after LTP induction are exhibited to the right of each graph. Scale bar, 400 msec, 0.5 mV.

