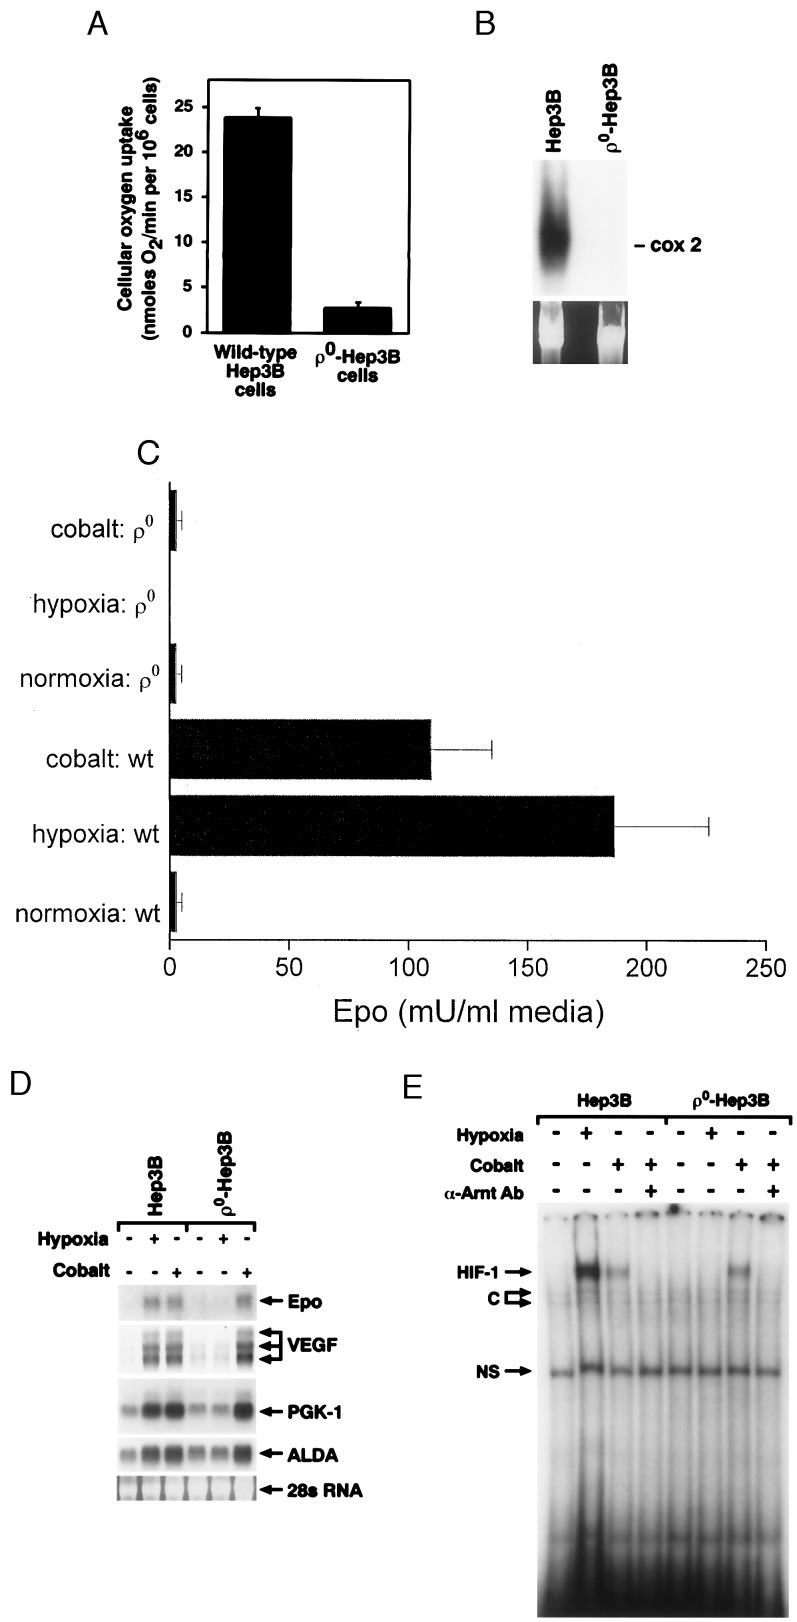
Figure 1.
(A) Cellular O2 uptake rates in wild-type and ρ0-Hep3B cells. (B) Southern blot analysis of undigested total cellular DNA from wild-type and ρ0-Hep3B cells. Hybridization was performed with a cytochrome oxidase subunit II probe, spanning bps 7757–8195, generated by reverse transcription–PCR. (C) EPO secretion from wild-type (wt) and ρ0-Hep3B cells exposed to normoxia (21% O2/5% CO2/74% N2), hypoxia (1.5% O2/5% CO2/93.5% N2), or CoCl2 (100 μM) during normoxia for 24 hr (n = 3, mean ± SD). EPO was measured by radioimmunoassay (46). (D) Northern blot analysis of RNA from wild-type and ρ0-Hep3B cells during normoxia (21% O2/5% CO2/74% N2), hypoxia (1.5% O2/5% CO2/93.5% N2), or CoCl2 (100 μM) during normoxia for 24 hr. ALDA, aldolase; PGK-1, phosphoglycerate kinase. (E) HIF-1 DNA binding in nuclear extracts from wild-type and ρ0-Hep3B cells. Both cell types were exposed to normoxia (21% O2/5% CO2/74% N2), hypoxia (1.5% O2/5% CO2/93.5% N2) or CoCl2 (100 μM) during normoxia for 4 hr. C, constitutive; NS, nonspecific.

