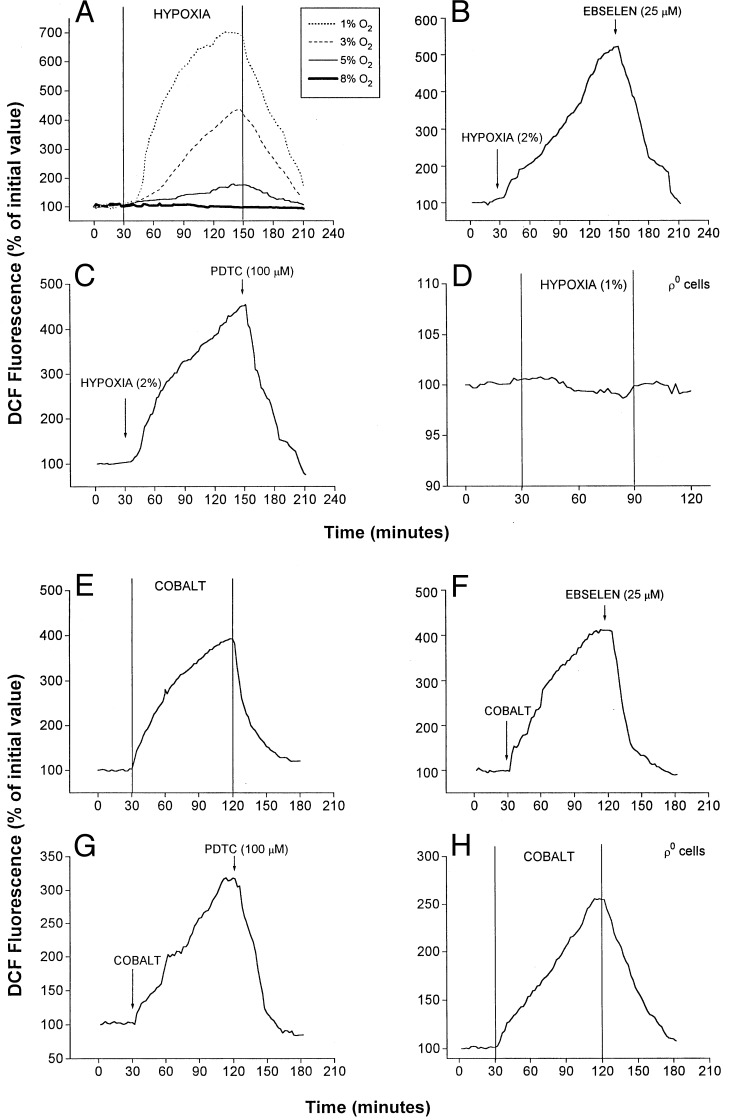
Figure 2.
Effect of hypoxia and CoCl2 on ROS generation. Graphs are averages from three experiments. (A) DCF fluorescence in wild-type cells at different levels of O2. Graded hypoxia was produced in a flow-through chamber perfused with solutions equilibrated with different gas mixtures. Duration of hypoxia was 2 hr, beginning 30 min after baseline normoxic (21% O2/5% CO2/74% N2) measurements. Recovery to normoxia was initiated at 150 min. (B) DCF fluorescence in wild-type cells during hypoxia (2% O2/5% CO2/93% N2) and ebselen (25 μM). (C) DCF fluorescence in wild-type cells during hypoxia (2% O2/5% CO2/93% N2) and PDTC (100 μM). (D) DCF fluorescence in ρ0-Hep3B cells during hypoxia (1% O2/5% CO2/94% N2). (E) DCF fluorescence in wild-type cells during normoxic CoCl2 (100 μM). (F) DCF fluorescence in wild-type cells during normoxic CoCl2 (100 μM) and ebselen (25 μM). (G) Effect of PDTC (100 μM) on DCF fluorescence during CoCl2 treatment in wild-type cells. (H) Effect of CoCl2 on DCF fluorescence in ρ0 cells.

