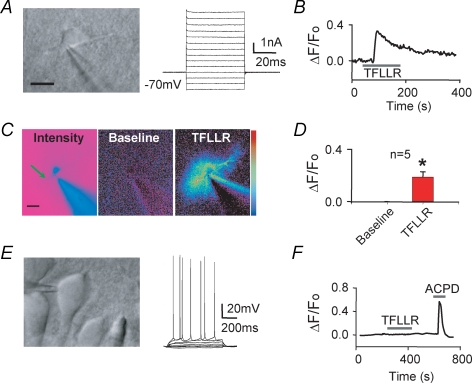
Figure 2.
TFLLR increases intracellular Ca2+ in glial cells but not in CA1 pyramidal cells in hippocampal slices A, DIC image of a glial cell (left panel) patched with 100 μm Oregon Green 488 BAPTA-2 included in the patch pipette (16 MΩ input resistance; VH = −70 mV; VM = −76 mV). Voltage steps of 10 mV were applied to this cell under voltage clamp (right panel), and revealed a linear current–voltage relationship with no activation of time-dependent currents. Calibration bar is 10 μm. B, changes in fluorescence intensity in the glial cell in A are shown during application of 30 μm TFLLR. C, fluorescence intensity in a glial cell (left, Intensity), also shown as fluorescent change as a ΔF/F0(as in B) before (centre, Baseline) and after 30 μm TFLLR application (right, TFLLR). The baseline image is generated by taking the ratio of (F −F0)/F0, where F0 is the first intensity image. During TFLLR application the ratio increased significantly in the soma as well as the processes. The colour scale on the right shows the pseudocolour coding of ratio values ranging from 0 (bottom) to 0.4 (top). D, the average changes in fluorescence are shown (± s.e.m.). The arrow in the left panel of C shows where the changes in fluorescence are monitored. *P < 0.05, paired t test. E, DIC image of a CA1 pyramidal neurone (left panel), patched with 100 μm Fluo-3 included in the patch pipette (VM = −62 mV left panel). Current injection of 10 pA steps under applied current clamp; membrane voltage changes and action potentials in this neurone are shown in the right panel. F, changes in somatic fluorescent intensity in dye-loaded CA1 neurones during application of 30 μm TFLLR and 100 μmtrans-ACPD, a broad spectrum metabotropic glutamate receptor agonist used as a positive control.

