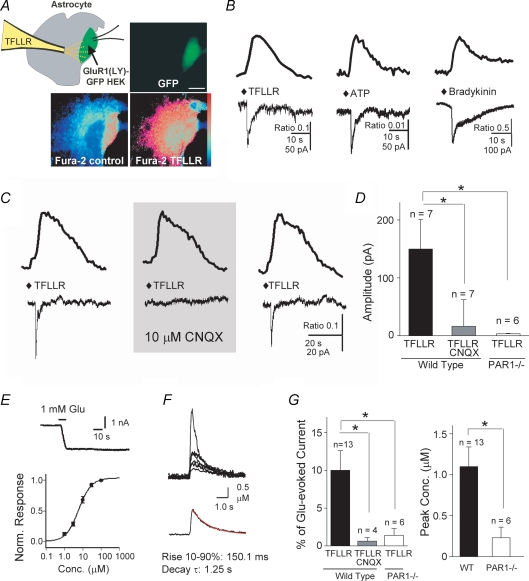
Figure 4.
Use of GluR1(L497Y) transfected HEK cells as biosensors for astrocytic glutamate release A, schematic diagram illustrating experimental setup is shown together with GFP fluorescent image of astrocyte–GluR1(L497Y)–GFP transfected HEK cell coculture (upper left panel). The lower panel shows the ratio image (510 nm emission; 340 nm/380 nm excitation) of Fura-2-AM loaded cocultures before and after brief (< 1 s) pressure-applied TFLLR (500 μm in pipette). Calibration bar is 20 μm. B, quantification of the fluorescence increase in response to brief (< 1 s) pressure application of 500 μm TFLLR, 300 μm ATP and 180 μm bradykinin from a pipette in a wild-type astrocyte (upper trace) recorded together with the inward current induced in an adjacent GluR1(L497Y)-transfected HEK cell (lower trace). C, CNQX reversibly inhibits TFLLR-evoked inward current in GluR1(L497Y) in a representative transfected HEK cell. The upper trace is Fura-2 fluorescence ratio, the lower trace is inward current. D, summary response in GluR1(L497Y) transfected HEK cells to TFLLR application to astrocytes shown as peak current in wild-type and PAR1−/− astrocyte cultures. CNQX significantly reduced the response of GluR1(L497Y)-transfected HEK cells to TFLLR application (n = 7; P < 0.05, 1-factor ANOVA). There is virtually no detectable current response recorded from GluR1(L497Y)-transfected HEK cells cocultured with PAR1−/− astrocytes in response to pressure application of TFLLR (3.4 ± 0.8 pA, n = 6, P < 0.05, 1-factor ANOVA, compared with wild-type response amplitude). E, the current response to pressure application of TFLLR was converted to concentration using the dose–response relationship and maximal current response of the GluR1(L497Y) transfected HEK cell as described in the Methods. EC50 value for glutamate activation of GluR1(L497Y) in transfected HEK cells was 6.1 μm (Hill slope 1.3). F, concentration responses from 7 cells are shown superimposed (upper panel) and below as an average (lower panel). G, summary response in GluR1(L497Y) transfected HEK cells to TFLLR application to astrocytes shown as percentage of the maximal response (TFLLR on WT: 10 ± 2.6%; TFLLR + CNQX on WT: 0.64 ± 0.47%; TFLLR on PAR1−/−: 1.4 ± 0.9%, *P < 0.05, 1-factor ANOVA), and concentration (WT: 1.1 ± 0.24 μm; PAR1−/−: 0.23 ± 0.13 μm, *P < 0.05, unpaired t test) in wild-type and PAR1−/− astrocyte cultures.

