Figure 4.
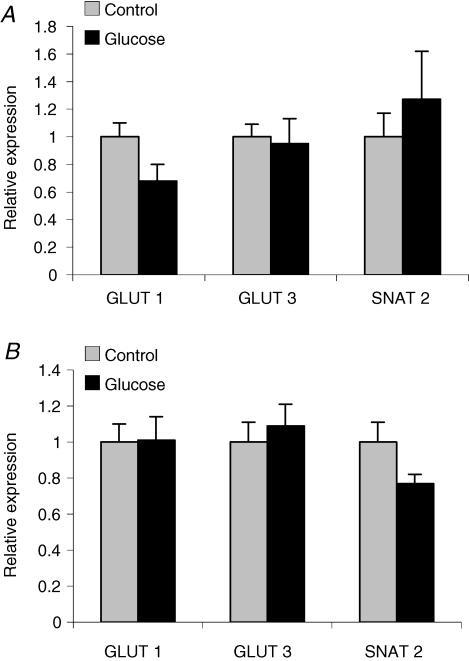
The mean protein density of GLUT1, GLUT3 and SNAT2 as measured by Western blot analysis in rat placental homogenates Placental were collected from rats injected i.p. with glucose (2 g kg−1) or saline (control) three times on GD 10 (A, n = 8–9) and from rats injected a total of six times on GD 10 and 11 (B, n = 9–11). No significant changes were observed between glucose- and saline-treated groups. The mean density of the control group was assigned a value of 1 and the mean density of the hyperglycaemic group was calculated relative to the control group. Values are given as means ± s.e.m.

