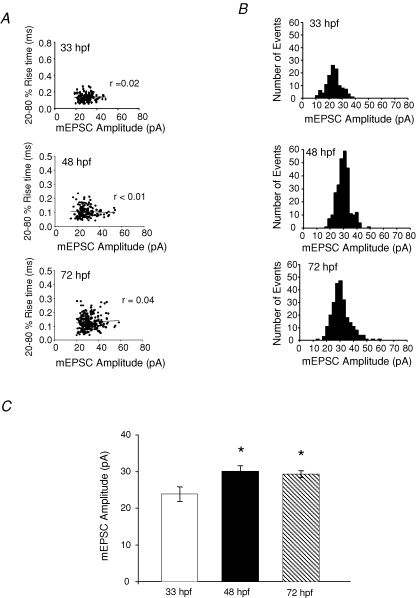
Figure 2.
Isolated non-NMDA mEPSCs from M-cells are properly space clamped A, scatter plots of rise time versus amplitude of events recorded from a 33 hpf preparation(r = 0.02; n = 158 events), 48 hpf preparation (r < 0.01; n = 218 events), and a 72 hpf preparation (r = 0.04; n = 249 events). B, amplitude histogram of mEPSCs from an M-cell recorded at 33 hpf, 48 hpf and 72 hpf in the presence of 1 μm TTX, 5 μm strychnine, 100 μm picrotoxin (bin width = 2 pA; n = 109 (33 hpf); n = 278 (48 hpf); n = 251 (72 hpf)). C, peak amplitude of non-NMDA mEPSCs recorded in the presence of 1 μm TTX, 5 μm strychnine, and 100 μm picrotoxin. (33 hpf: 24 ± 2.0 pA, n = 10 embryos; 48 hpf: 30 ± 2 pA, n = 9 larvae and 72 hpf: 30 ± 1 pA, n = 8 larvae). C, holding potential was −60 mV. *Significantly different from 33 hpf, P < 0.05. Error bars represent s.e.m.

