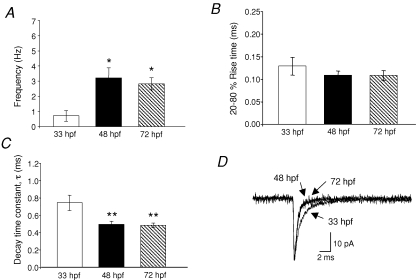
Figure 3.
Frequency, rise time and decay kinetics of non-NMDA mEPSCs A, frequency bar graph of the mEPSCs recorded at different ages. B, 20–80% rise time was 0.13 ± 0.02 ms at 33 hpf (n = 10 embryos); 0.11 ± 0.01 ms at 48 hpf (n = 9 larvae) and 0.11 ± 0.01 ms at 72 hpf (n = 8 larvae). C, bar graph of the decay time constant which was fitted with a single exponential function. τ was 0.75 ± 0.09 ms at 33 hpf (n = 10 embryos), 0.50 ± 0.03 ms at 48 hpf (n = 9 larvae) and 0.49 ± 0.03 ms at 72 hpf (n = 8 larvae). D, superimposed averaged mEPSC at 33 hpf, 48 hpf and 72 hpf. Note the slower decay at 33 hpf. The holding potential was −60 mV *Significantly different from 33 hpf P < 0.05; **significantly different from 33 hpf P < 0.01.

