Figure 4.
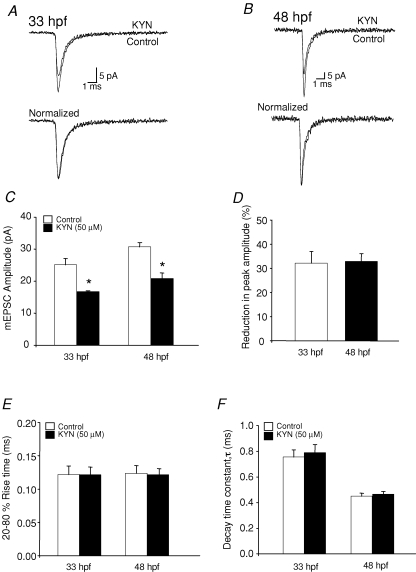
Effect of the glutamate receptor antagonist kynurenic acid (KYN) on AMPAR-mEPSC A, superimposed (top) and normalized (bottom) mEPSCs recorded from 33 hpf M-cells in the absence and presence of 50 μm KYN (n = 4 embryos) B, superimposed (top) and normalized (bottom) mEPSCs recorded from 48 hpf M-cells in the absence (control) and presence of 50 μm KYN (n = 5 larvae). C, mEPSC peak amplitude recorded in the absence (control, open bars) and presence (filled bars) of 50 μm KYN at 33 hpf (n = 4 embryos) and 48 hpf (n = 5 larvae). D, bar graph showing percentage inhibition of peak amplitude induced by 50 μm KYN at 33 hpf and 48 hpf. E, 20–80% rise time bar graph of the mEPSCs recorded in the absence (control, open bars) and presence (filled bars) of 50 μm KYN at 33 hpf (n = 4 embryos) and 48 hpf (n = 5 larvae). F, bar graph of the decay time constant, τ, at 33 hpf (n = 4 embryos) and 48 hpf (n = 5 larvae) recorded in the absence (control, open bars) and presence (filled bars) of 50 μm KYN. *Significantly different from control, P < 0.05.

