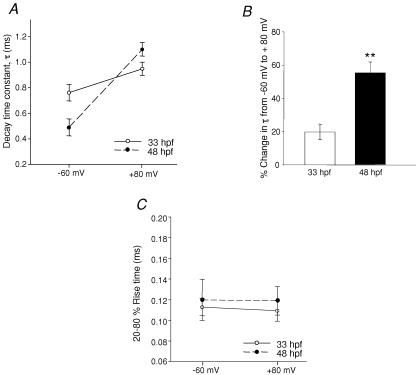
Figure 6.
Voltage dependence of AMPAR-mEPSC decay time constant All events were recorded in the presence of strychnine (5 μm), picrotoxin (100 μm), APV (50 μm) and TTX (1 μm) to isolate AMPA mEPSCs at all holding potentials. A, plot of mEPSC decay time constant at −60 mV and +80 mV at 33 hpf (n = 4 embryos, ○ and continuous line) and at 48 hpf (n = 4 larvae, • and dashed line). B, bar graph showing the percentage change in τ from −60 mV to +80 mV. C, plot of 20–80% rise time at −60 mV and +80 mV. *Significance at P < 0.05 and ** at P < 0.01.

