Figure 7.
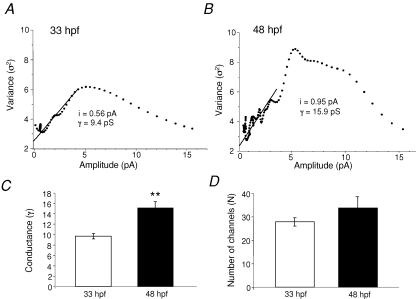
Estimates of synaptic conductance and the number of available AMPARs underlying mEPSCs A, plot of variance versus mean current amplitude of mEPSCs at 33 hpf. B, plot of variance versus mean current amplitude of mEPSCs at 48 hpf. The line (A and B) indicates the fit of the initial portion of the plot to the theoretical equation (see Methods) and it gives an estimate of the elementary current (i) generated by the activation of one receptor. The conductance (γ) was calculated from the equation. γ = i/VH (VH = −60 mV). In the experiments shown, γ = 9.4 pS at 33 hpf and 15.9 pS at 48 hpf. C, bar graph of the conductance at 33 hpf (9.6 ± 0.5, n = 5 embryos) and 48 hpf (15.2 ± 1.2, n = 6 larvae). D, bar graph of the number of the available AMPARs, N, at 33 hpf (27 ± 2) and 48 hpf (33 ± 5). *Significance at P < 0.05 and ** at P < 0.01.

