Figure 8.
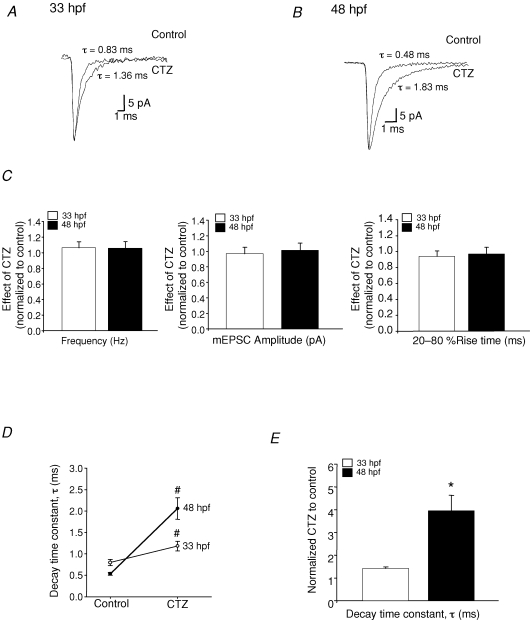
Effects of CTZ on AMPAR-mEPSCs A, average mEPSCs recorded from 33 hpf M-cells in the absence (control) and presence of 10 μm CTZ (n = 3 embryos, VH = −60 mV). B, average mEPSCs recorded from 48 hpf M-cells in the absence (control) and presence of 10 μm CTZ (n = 4 larvae). Events recorded in the presence of CTZ were normalized to their controls recorded in the absence of CTZ. C, bar graphs showing the effect of CTZ on the frequency, peak amplitude and 20–80% rise time at 33 hpf (open bars) and 48 hpf (filled bars). D, the decay time constant (τ) of averaged mEPSCs at 33 hpf and 48 hpf in the presence of 10 μm CTZ. E, bar graph showing τ of mEPSCs recorded in 10 μm CTZ normalized to control mEPSCs recorded in the absence of CTZ, illustrating the effect of CTZ on the decay time constant of the mEPSCs at 33 hpf and 48 hpf. *Significantly different from the age group 33 hpf, P < 0.05; #significantly different from control P < 0.05.

