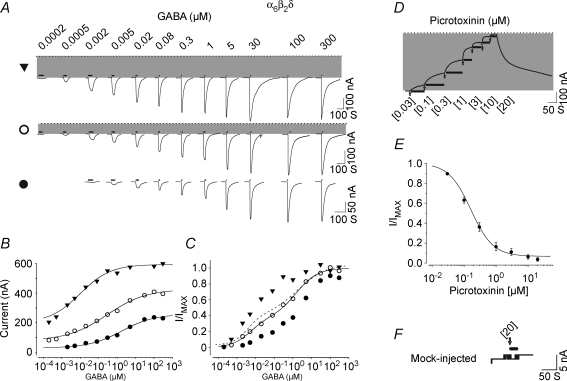
Figure 1.
α6β2δ receptors exhibit spontaneous activity and two separable state of agonist affinities A, representative GABA current traces for high (top), intermediate (middle) and low (bottom) expression conditions with oocytes clamped at −70 mV. The dotted line indicates the zero-current level; the shaded area represents the spontaneous activity. The thick lines above the current traces represent the duration of GABA application. The duration of agonist application decreased with increasing concentration of agonist since the currents reached steady state (peaked) more rapidly at higher concentrations of agonist. B, plot of GABA concentration–response relationships including the spontaneous currents. All data were fitted with a single Hill equation. C, concentration–response relationship of the normalized GABA currents. The EC50, nH and maxima parameters for the group data for high, intermediate and low expression conditions are shown in Table 1. The continuous line shows the plot of the fit of a sum of two Hill equations to the data points from an oocyte with intermediate expression level demonstrating the presence of two components with different sensitivities to GABA. The dashed line shows the overall plot of the fit (group data) of sum of two Hill equations to the GABA concentration–response data points for the α6β2δ receptor at median expression. D, a representative current trace for consecutive application of 0.03–20 μm picrotoxinin on an oocyte with high expression of α6β2δ recptor. The thick lines below the current traces represent the duration of antagonist application. The arrow indicates the start of the picrotoxinin application at the concentration shown below it. E, the concentration–response relationship for picrotoxinin block of the spontaneous current form α6β2δ receptor. Picrotoxinin inhibited greater than 90% of the spontaneous current with an IC50 of approximately 0.2 μm.F, the effect of 20 μm picrotoxinin application on the leak current (20 nA) from a mock-injected oocyte (see methods).

