
Fig. 8.
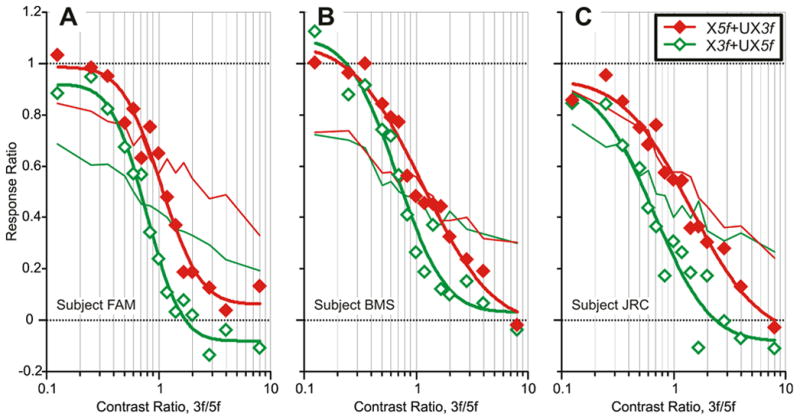
The initial horizontal vergence responses to dual-grating stimuli with two disparities of opposite sign: dependence of the Response Ratio on the Contrast Ratio (data for 3 subjects). Based on data obtained with the X5f+UX3f stimuli (filled red diamonds) and the X3f+UX5f stimuli (open green diamonds). Continuous smooth curves are best-fit Cumulative Gaussian functions. Thin lines are the vector-sum predictions (red: X5f+UX3f stimuli; green: X3f+UX5f stimuli). (A): subject FAM (n=185–197 response samples per stimulus). (B): subject BMS (n=137–145). (C): subject JRC (n=182–198).