
Fig. 4.
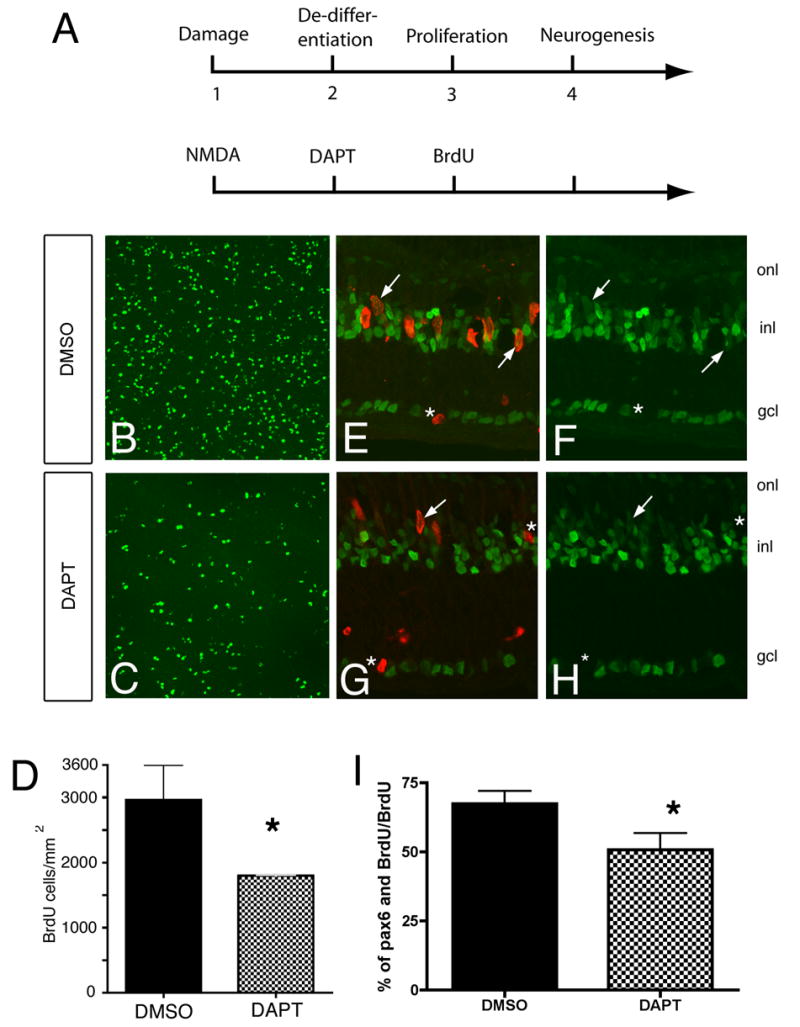
Müller glia proliferation and de-differentiation decrease when intraocular injections of DAPT are made early in the regeneration process. (A) Schematic diagram of injections made during experiment. (B-C) Retinal flatmounts stained with BrdU from chicks treated as shown in panel A, with either DMSO (B) or DAPT (C) at P2. Chicks were sacrificed on P8. Notice there is extensive proliferation in the DMSO injected retina, which has been decreased in the DAPT injected retina. (D) Quantification of proliferation. BrdU was quantitated from flattened confocal stacks from 3 different regions of 3 different birds using ImageJ software. (Error bars represent s.e.m., n = 3, *p = 0.05, one tail Mann-Whitney test). (E-I) Birds were treated as shown in A, with DMSO (E, F) or DAPT (G, H) at P2 and sacrificed 4 hours after BrdU injection. The percentage of BrdU positive cells that costain with Pax6 and BrdU is less in DAPT treated retinas than in DMSO treated retinas, indicating that DAPT treatment inhibits de-differentiation. Pax6 labeling is shown in green, BrdU in red. The arrows indicate Pax6, BrdU double-positive cells. In the DMSO treated retina, most BrdU positive cells were pax6 positive. The asterisks indicate BrdU positive cells that are not Pax6 positive. (I) Quantification of de-differentiation. Data graphed is the percent of BrdU and Pax6 double-labeled cells out of the BrdU labeled cells that are in the INL, OPL and ONL. (regions where de-differentiating Müller glia reside.) (Error bars represent s.e.m., n = 7, *p = 0.0364, one tail Mann-Whitney test)