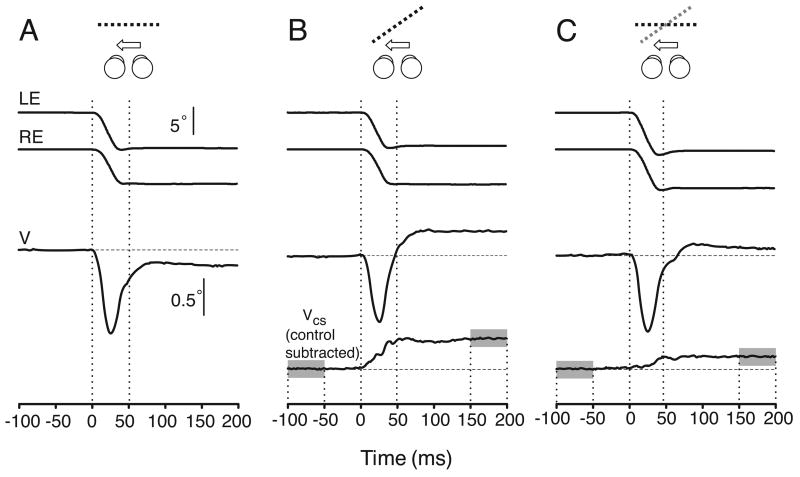
Figure 3.
Time course of the version and vergence eye movements associated with horizontal gaze shifts (sample raw data from one subject, BMS). A. No compressions were applied so the two images are identical and the single binocular surface is fronto-parallel (control). B. A 6% horizontal compression was applied to the left image (geometric effect). C. A 12% vertical compression was applied to the right image (induced effect). Cartoons indicate the slant stimuli (seen from above): black dotted lines, slant resulting from the horizontal size disparity (geometric effect); gray dotted line, perceived slant caused by the vertical size disparity (induced effect); arrows, direction of the horizontal gaze shifts. LE and RE: horizontal position of left and right eye. V: horizontal vergence position (LE-RE). VCS: Horizontal vergence position after subtracting mean control vergence. Vertical calibration bars: 5° applies to eye position data (LE and RE traces), 0.5° applies to vergence (V and VCS traces). Time zero is the start of the saccades. Vergence changes were examined quantitatively using the difference in the value of VCS averaged over the 50-ms time intervals starting 100 ms before and 150 ms after the onset of the saccade (gray areas).

