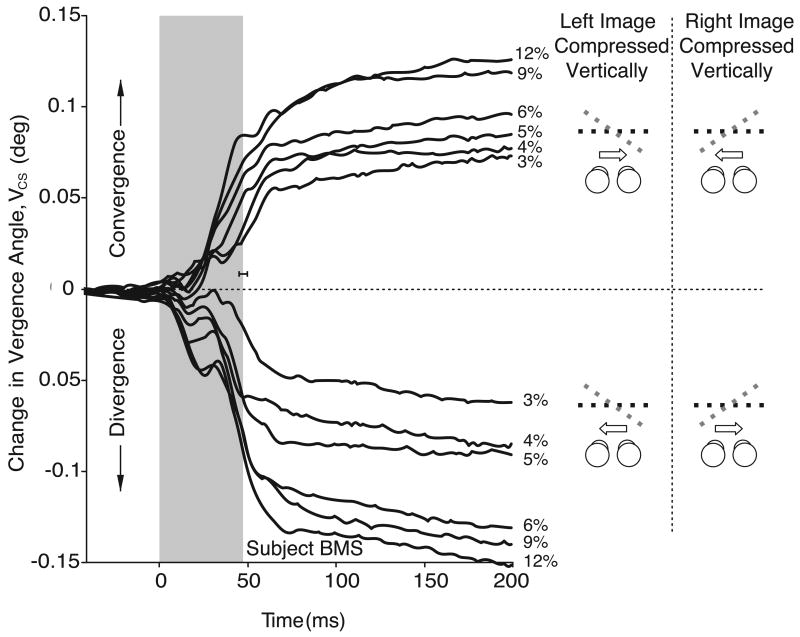
Figure 5.
Mean temporal profiles for the vergence responses linked to gaze shifts, VCS: dependence on vertical compression (data for one subject, BMS). Each trace is an average of at least 59 individual responses. Cartoons depict a plan view of the zero slant resulting from the zero horizontal size disparity (black dashed lines), and the perceived slant resulting from the vertical size disparity (gray dashed lines). Convergence was observed when gaze shifted away from the side of the eye that viewed the compressed pattern (upper traces); divergence was observed when gaze shifted towards the side of the eye that viewed the compressed pattern (lower traces). Other conventions as in Figure 4.

