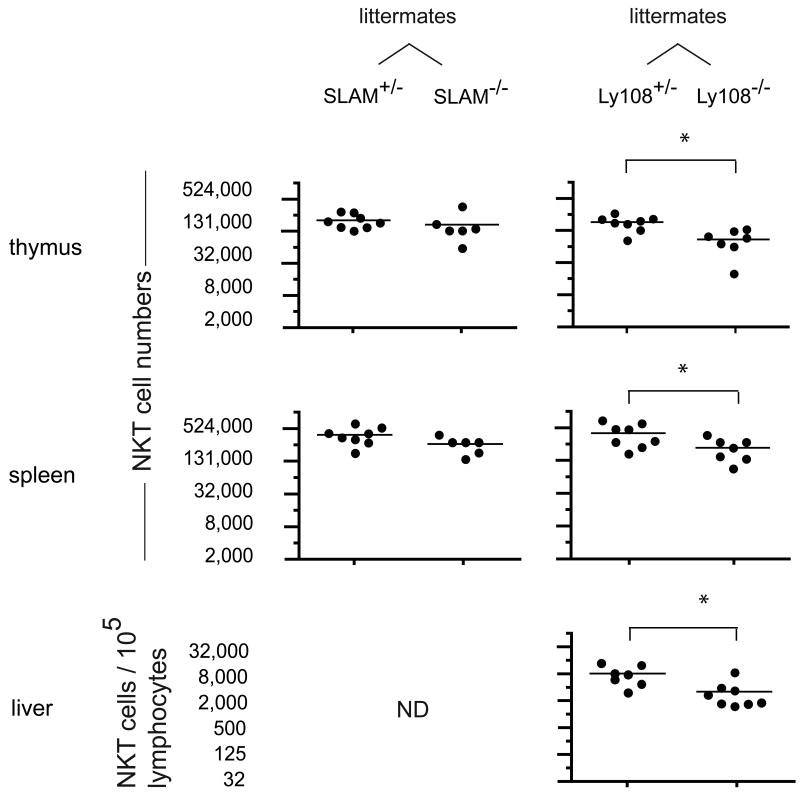
Figure 3. Individual contributions of SLAM and Ly108 to NKT cell development.
Scatter plots showing absolute numbers (log2 scale) of CD1d-αGalCer positive cells in individual thymi, spleens and livers of 3-5 week-old SLAM +/- and -/- littermates and Ly108 +/- and -/- littermates. Because of variations in liver lymphocyte recovery between experiments, liver NKT cell numbers are enumerated per 105 lymphocytes. Liver NKT cells were not examined in SLAM -/- mice (ND, not determined). * denotes statistical significance (p<0.05) using an unpaired t test.

