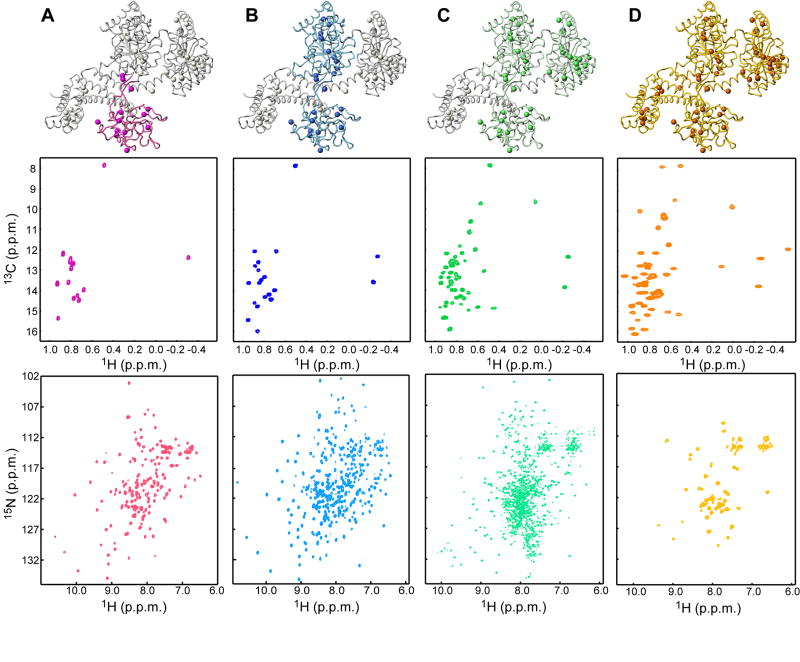
Figure 2. Strategy for the assignment of methyl correlations of SecA.
Each column in the figure displays a structural model of one of the protomers of SecA with the domain or fragment studied in isolation being highlighted, along with the corresponding 1H-13C HMQC of Ile-δ1 methyls (displayed as spheres in the model) and the backbone 1H-15N HSQC.
(A) PBD (residues 220-379).
(B) SecAΔC/ΔIRA2 (residues 1-420, comprising NBD and PBD).
(C) SecAΔC (residues 1-610, comprising NBD, PBD and IRA2).
(D) Full-length SecA (residues 1-901). Only few resonances for the backbone of the full-length SecA are visible (Figure S9).

