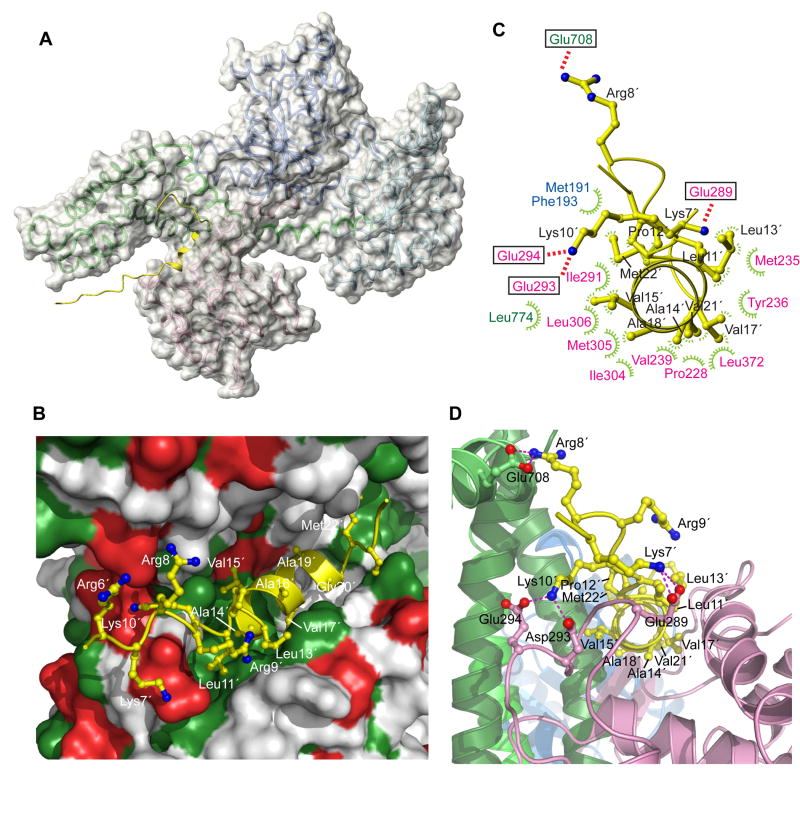
Figure 3. Structural basis for signal peptide recognition by SecA.
(A) The lowest-energy structure of SecA bound to the KRR-LamB signal peptide is shown. SecA is displayed as a semi-transparent solvent-accessible surface and the signal peptide is shown in yellow. A ribbon model is displayed below the surface (color code is as in Figure 1B).
(B) Closer view of the groove bound to the signal peptide. Green and red surface indicates hydrophobic and acidic residues, respectively. Peptide is shown as a ribbon ball-and-stick representation and most of its residues are numbered.
(C) Contacts between the peptide (shown in yellow) and SecA residues. Electrostatic and hydrophobic interactions are indicated with red and green lines, respectively. SecA residues are colored according to the domain they are located at.
(D) A view of the groove bound to the signal peptide, wherein SecA is shown in ribbons. The peptide orientation is similar to that in (C). Dotted lines indicate electrostatic interactions between basic peptide residues and acidic SecA residues. Primed numbers indicate peptide residues.

