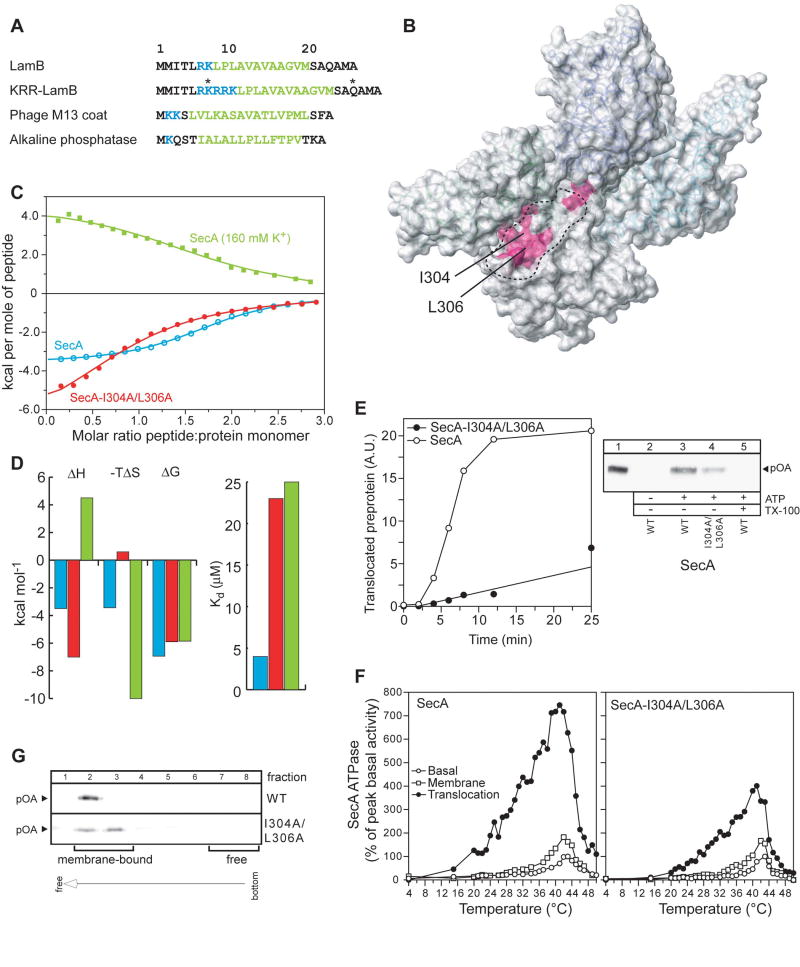
Figure 4. Signal peptide binding to SecA and the effect of its impairment on the function of SecA.
(A) The four different signal sequences used in the present study are shown. In KRR-LamB, the asterisks indicate the positions where a single Cys mutation was introduced, followed by the incorporation of the nitroxide spin label. Basic and hydrophobic residues are colored blue and green, respectively.
(B) Chemical shift mapping of the interaction of the signal peptides shown in (A) with SecA. The magenta colored region indicates the common residues whose chemical shift is significantly affected upon signal peptide binding (see text for details).
(C) Binding isotherms of the calorimetric titration of the KRR-LamB signal peptide to SecA (open, cyan circles), SecA-I304A/L306A (filled, red circles), and SecA in 160 mM K+ buffer (green squares). In the first two cases, SecA is in 40 mM K+ buffer. Ile304 and Leu306, whose position within the groove is indicated in (B), were mutated to assess the relative contribution of hydrophobic interactions in SecA-signal peptide binding, whereas higher buffer salt was used to assess the contribution of electrostatic interactions.
(D) Thermodynamic parameters of the calorimetric titrations in (C) displayed as bars. The color code is as in (C). Weakening of the electrostatic interactions results in hydrophobic interactions being the dominant driving force for complex formation, as suggested by the observation that the reaction becomes enthalpically unfavorable, but strongly entropically favorable.
(E) ATP-driven in vitro translocation of proOmpA-His into SecYEG-containing IMVs catalyzed by SecA or SecA-I304A/L306A (right panel). Lane 1: 5% of undigested proOmpA-His input. Lane 5: membranes were dissolved with Triton x-100 (1%) prior to proteinase K addition. Proteins were TCA-precipitated, analyzed by SDS-PAGE and immunostained with α-His antibody. Left panel: Time-course of proOmpA translocation kinetics. 20 A.U. corresponds to 1.6 pmol of translocated proOmpA.
(F) kcat values (pmoles Pi/pmol SecA protomer per min) of basal, membrane and translocation ATPase activities of SecA as a function of temperature. Averaged data of three repetitions are shown.
(G) IMV flotation assay showing weaker binding of proOmpA to SecYEG-bound SecA- I304A/L306A than to wild-type SecA.

