
Fig. 3.
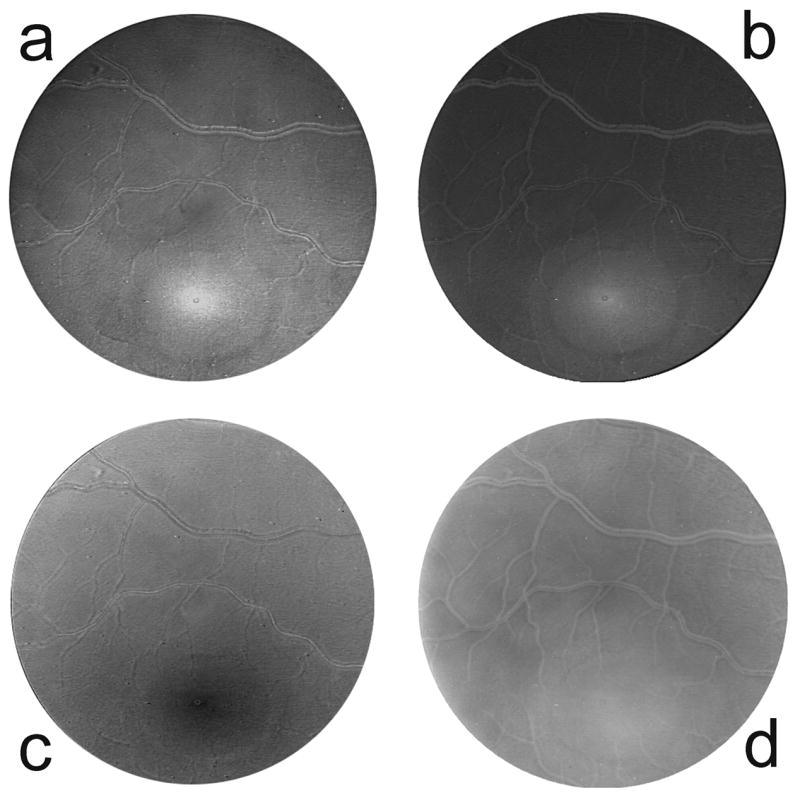
Relative optical density distributions of a) macular pigment at 460 nm, b) cone photopigment at 550 nm, c) rod photopigment at 505 nm, and d) melanin at 460 nm. The relative optical densities are represented by the pixel values in these images (i.e. higher optical density = brighter pixel). Thus the macular pigment (a) and cone photopigments (b) can be seen to peak in the fovea (lower center), the rod photopigments (c) dip to a minimum in the fovea, and melanin (d) is more broadly distributed.