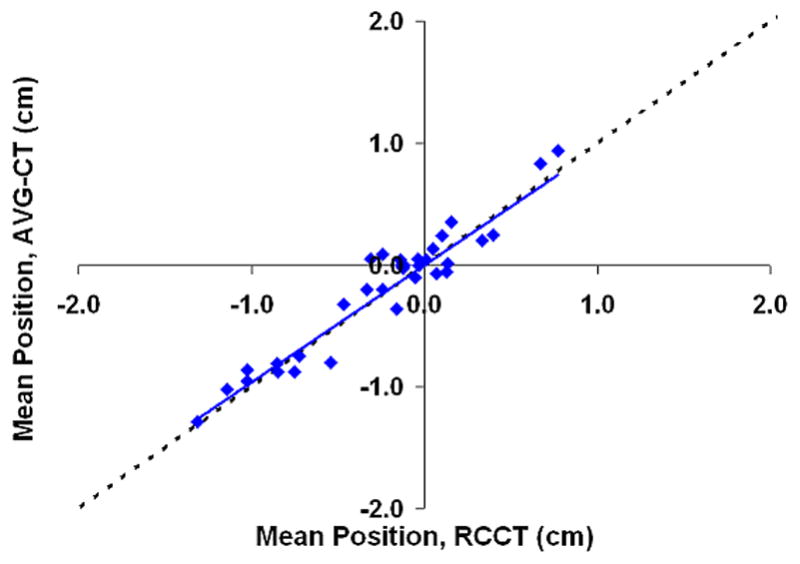
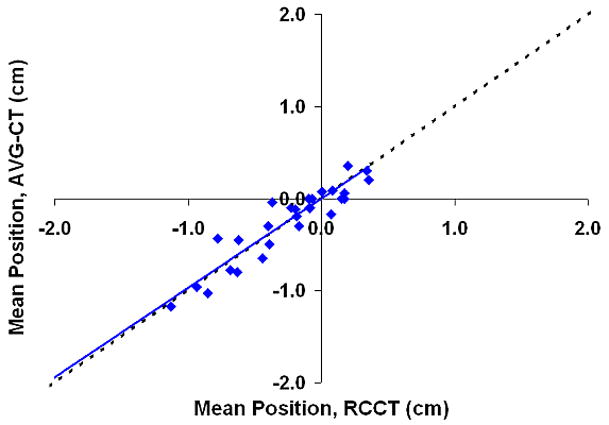
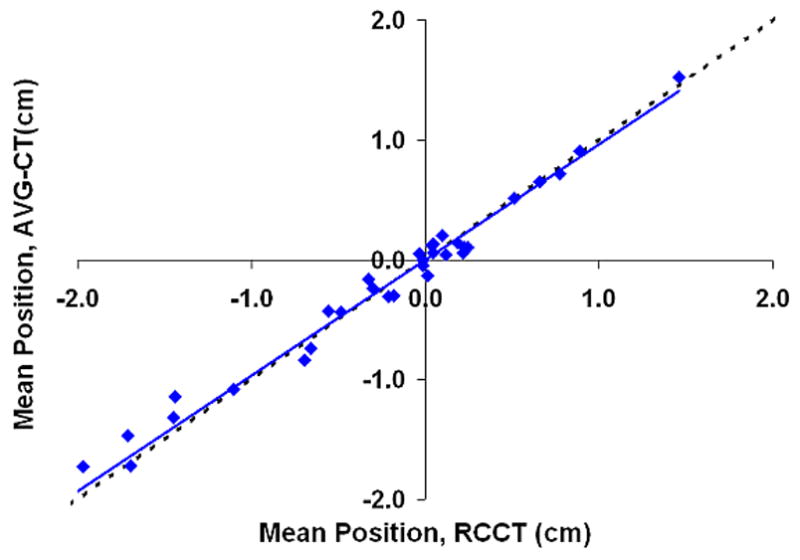
Figure 5.


Shift in the mean tumor position in relation to the planned mean position, eight patients, measurements using the AVG-CT method vs. measurements using the RCCT method. The dashed line represents exact one-to-one correlation. The solid line is the linear fit of the data. (A) Lateral direction. (B) Anterio-posterior direction. (C) Cranio-caudal direction.
