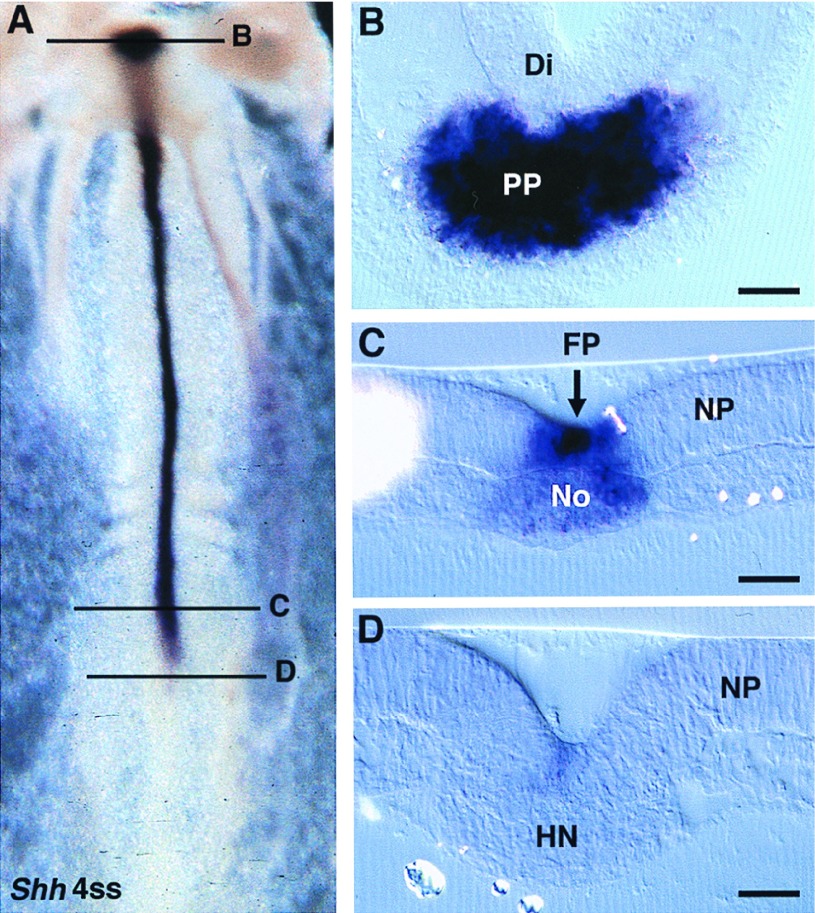
Figure 3.
Shh expression pattern in 4ss chicken embryos. (A) Whole mount ventral view. (B) Transverse section at the diencephalon level (Di) shows the prechordal plate (PP) strongly expressing Shh. (C) Immediately rostral to Hensen’s node, the floor plate (FP) is more strongly positive than the notochord (No). (D) In Hensen’s node region (HN), Shh is slightly and evenly expressed in the superficial layer, the future floor plate. NP, neural plate. (Bars = 80 μm.)

