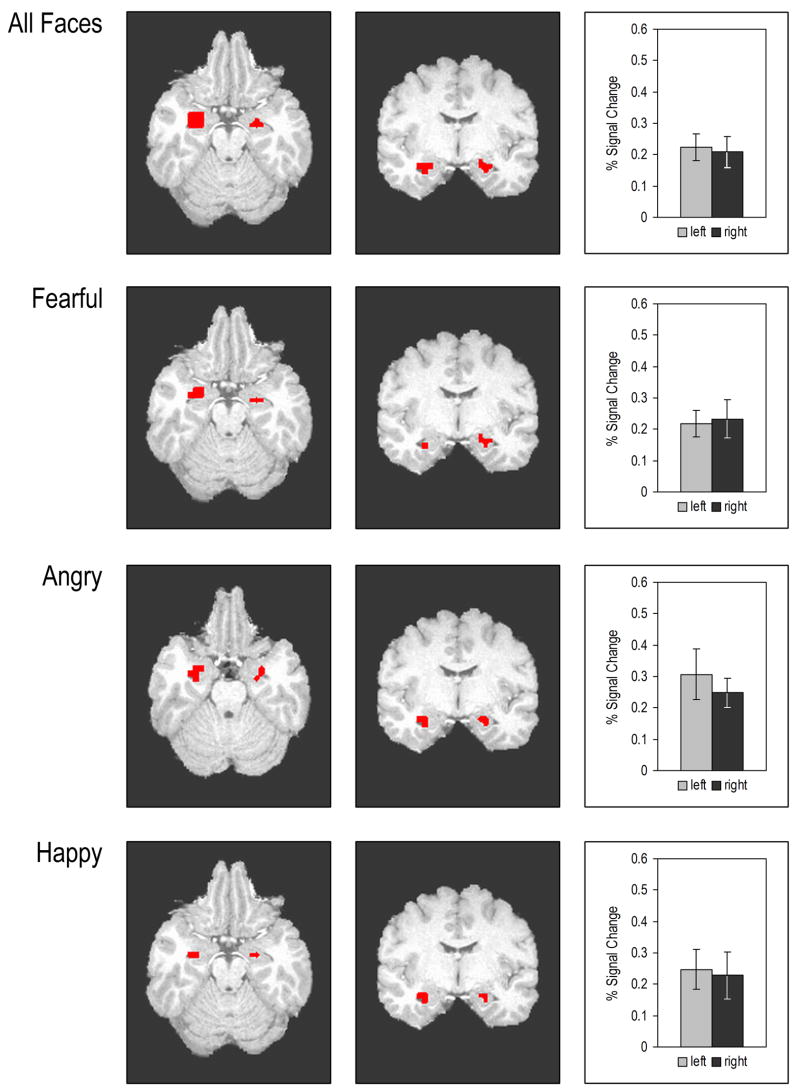
Figure 1.
Axial and Coronal views showing significant amygdala activation to All Faces, Fearful, Angry, and Happy vs. Shape conditions. The All Faces brain images and bar graphs represent the sum total of the amygdala activation to Fearful + Angry + Happy Faces compared to the control Shape condition. Bar graphs show percent signal changes in the left and right amygdala. Error bars indicate Standard Erro Error.

