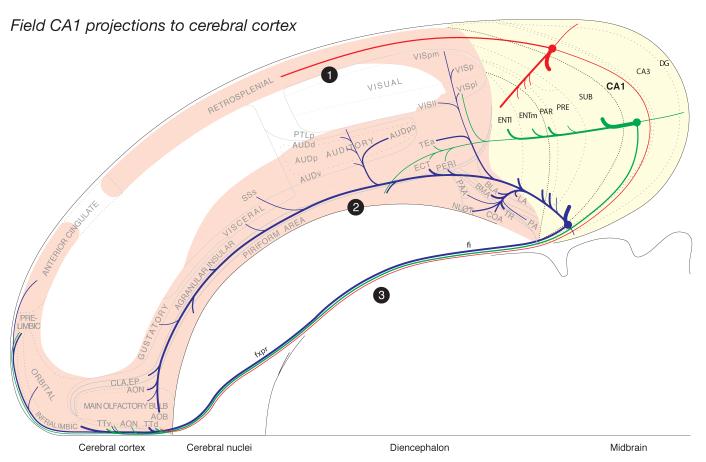
Fig. 2.
Summary diagram to indicate the general organization of projections from dorsal (red), intermediate (green), and ventral (blue) levels of field CA1 to the rest of the hippocampal formation (shaded yellow), and then the rest of the cortical mantle (shaded light red). Note three general projections to the rest of the cortex: dorsal (1) to the retrosplenial area and caudal end of the anterior cingulate area, ventral (2) through the longitudinal association bundle, and rostral (3) via a cortical-subcortical-cortical pathway involving the fornix system. Projections to the diencephalon were described previously (Cenquizca and Swanson, 2006), and those to the cerebral nuclei will be described in the next contribution to this reevaluation of field CA1 efferents. The relative size of each pathway is roughly proportional to the thickness of the line representing it. The flatmap is based on Swanson (2004).

