
Fig 2.
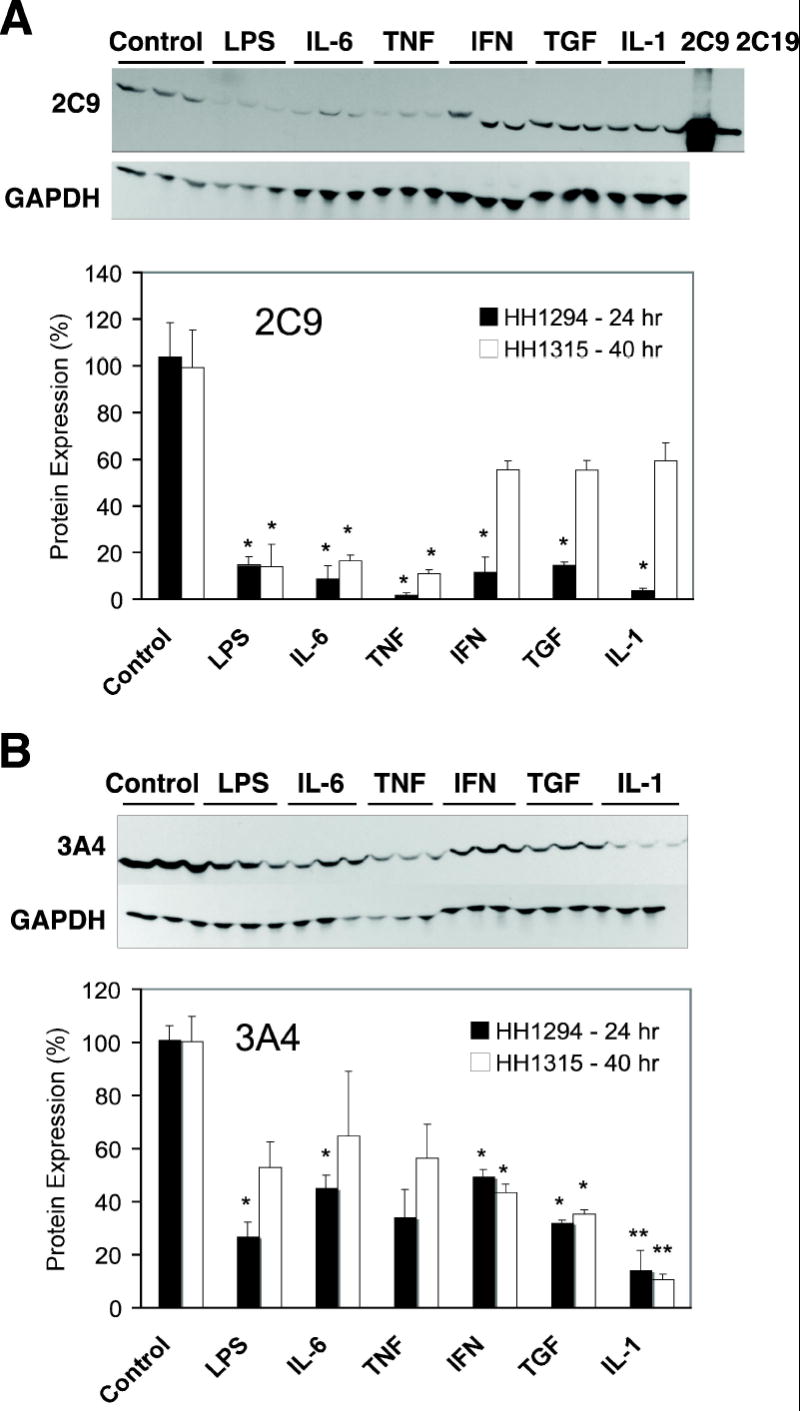
Regulation of human CYP 2C and 3A protein expression by cytokines. Cells from patient HH1294 or HH1315 were cultured in T25 flasks, and treated with phosphate-buffered saline (1 μl/ml, Control), lipopolysaccharide (LPS, 10 μg/ml), interleukin-6 (IL-6, 10ng/ml)), tumor necrosis factor-α (TNF, 10ng/ml)), interferon-γ (IFN, 10ng/ml)), tumor growth factor-β (TGF, 10ng/ml) or interleukin-1 (IL-1, 5ng/ml) for 24 or 40 hr, respectively. Cell lysates were prepared and Western blot assays for (A) CYP2C9 and (B) CYP3A4 were performed as described in Methods. Lanes marked 2C9 and 2C19 were loaded with 1 μg of insect cell microsomes (Supersomes) expressing the respective CYPs. In each section, the upper panels show Western blots of HH1315 (40 h treatment) probed for CYP2C9 or CYP3A4. Blots reprobed with antibody to glyceraldehyde 3-phosphate dehydrogenase (GAPDH) are displayed under the respective CYP blots. In the lower panels, relative levels of CYP proteins were quantified, normalized to GAPDH to account for any loading or transfer discrepancies, and plotted as a percentage of the control group mean. Data represent the means ± S.E.M. of three independent samples for each group. Significant differences compared with control are denoted by *=p < 0.05 and **= p < 0.005.