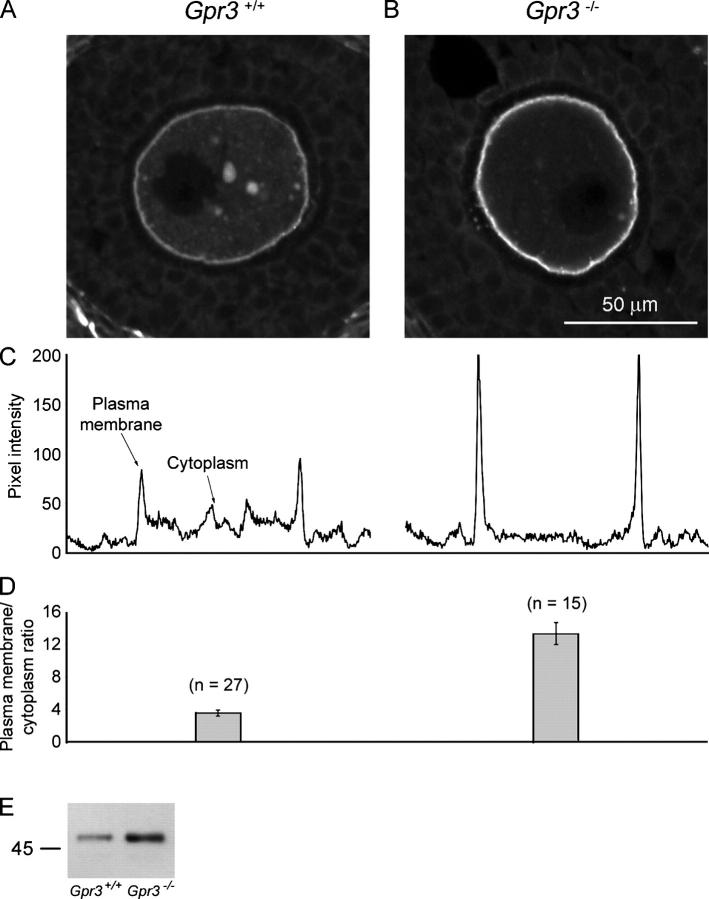
Figure 2.
Immunofluorescence localization and immunoblotting of Gαs in oocytes in Gpr3 + / + and Gpr3 − / − ovaries. (A and B) Gαs in Gpr3 +/+ (A) and Gpr3 −/− (B) oocytes in a preantral follicle. The confocal microscope settings and bars were the same for A and B; the dark region in each oocyte is the nucleus. (C) Pixel intensity on a scale of 0–255 along a line drawn through each oocyte image, choosing a line that avoided the nucleus. (D) Plasma membrane-to-cytoplasm Gαs fluorescence ratios for Gpr3 +/+ and Gpr3 −/− oocytes, which were determined as described in Fig. S1 (available at http://www.jcb.org/cgi/content/full/jcb.200506194/DC1). Mean ± SEM (error bars; n = number of oocytes). The fluorescence ratios for Gpr3 +/+ oocytes (3.6 ± 0.3) and Gpr3 −/− oocytes (13.4 ± 1.3) were significantly different (t test, P = 0.0001). Data are from two Gpr3 +/+ and two Gpr3 −/− mice; ovaries from mice of the two genotypes were processed in parallel. (E) Immunoblot comparing the amount of Gαs protein in Gpr3 +/+ and Gpr3 −/− oocytes that were isolated from preantral follicles. 15 oocytes per lane. The 52-kD splice variant of Gαs is predominant in mouse oocytes, although a small amount of the 45-kD form is present (Fig. 4 B; Mehlmann et al., 2002).

