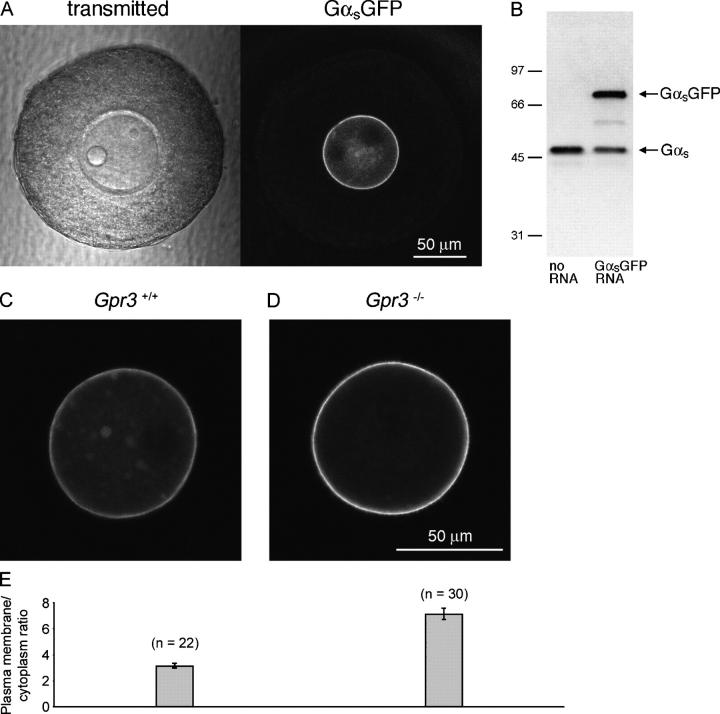
Figure 4.
GαsGFP fluorescence in Gpr3 + / + and Gpr3 − / − preantral follicle-enclosed oocytes. (A) Scanning transmission and fluorescence images of a Gpr3 +/+ preantral follicle in which the oocyte had been injected with GαsGFP RNA 20 h before. In the transmitted light image of the oocyte, the bright sphere on the left is an oil drop that was introduced by microinjection; the nucleus and nucleolus are visible on the top right. In the fluorescence image, the oil drop and nucleus appear as dark areas where GαsGFP is excluded. (B) Immunoblot comparing the amount of GαsGFP and endogenous Gαs in GαsGFP RNA-injected and noninjected oocytes from a Gpr3 +/+ mouse. Oocytes were injected with the RNA while inside their preantral follicles; after culturing the follicles overnight, the oocytes were isolated, and gel samples were prepared (14 oocytes per lane). The blot was probed with an antibody against Gαs (RM). The ratio of GαsGFP protein in the injected oocytes to Gαs in uninjected control oocytes was 1.1–1.5 (range for two experiments). The expression of GαsGFP caused some reduction of endogenous Gαs protein. (C and D) GαsGFP fluorescence in Gpr3 +/+ (C) and Gpr3 −/− (D) oocytes. (C) Fluorescence is present in the plasma membrane, in spots in the cytoplasm, and diffusely within the cytoplasm. (D) Fluorescence is present primarily in the plasma membrane. The confocal microscope settings and bars were the same for C and D. (E) Plasma membrane-to-cytoplasm fluorescence ratios for Gpr3 +/+ and Gpr3 −/− oocytes. Mean ± SEM (error bars; n = number of oocytes). Ratios for Gpr3 +/+ oocytes (3.1 ± 0.2) and Gpr3 −/− oocytes (7.1 ± 0.4) were significantly different (t test, P < 0.0001). Data are from three Gpr3 +/+ and three Gpr3 −/− mice.

