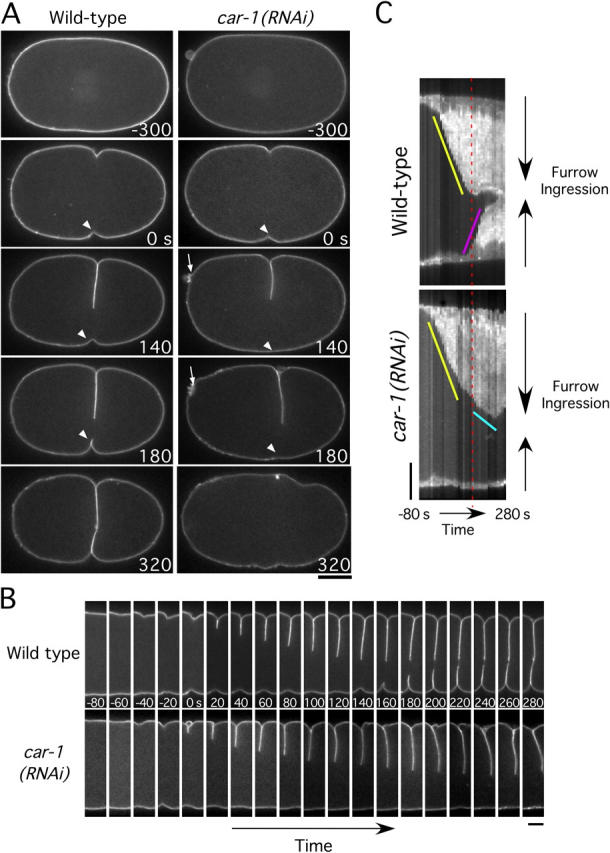
Figure 5.

Disruption of cleavage furrow ingression in CAR-1–depleted embryos. (A) Selected panels from time-lapse sequences of wild-type (left column) and CAR-1–depleted (right column) embryos expressing GFP:PHPLC1δ1, which localizes to the plasma membrane. Time in seconds after initiation of furrowing is indicated in the lower right corner of each panel. (See also Video 5.) Bar, 10 μm. Arrows highlight the failure of polar body extrusion. Arrowheads point to secondary furrow, which fails to ingress in CAR-1–depleted embryos. (B) Same as in A, except only a 7.3-μm wide vertical section containing the furrow is shown for each time point. Bar, 5 μm. (C) Kymographs of the regions shown in B, comparing furrow ingression in wild-type and CAR-1–depleted embryos (see Methods and materials for details on kymograph construction). The slope of the yellow line indicates the initial rate of primary furrow ingression, which is identical in wild-type and CAR-1–depleted embryos. In wild-type embryos, the primary furrow encounters the midbody and ceases to ingress (time indicated by red dashed line). At a similar time in CAR-1–depleted embryos, the primary furrow slows (cyan line) but does not stop. In wild-type embryos, a secondary furrow begins to ingress from the opposite side of the embryo (pink line) as the primary furrow ceases its inward movement. In CAR-1–depleted embryos, no ingression of a secondary furrow is observed. Bar, 5 μm.
