
Figure 2.
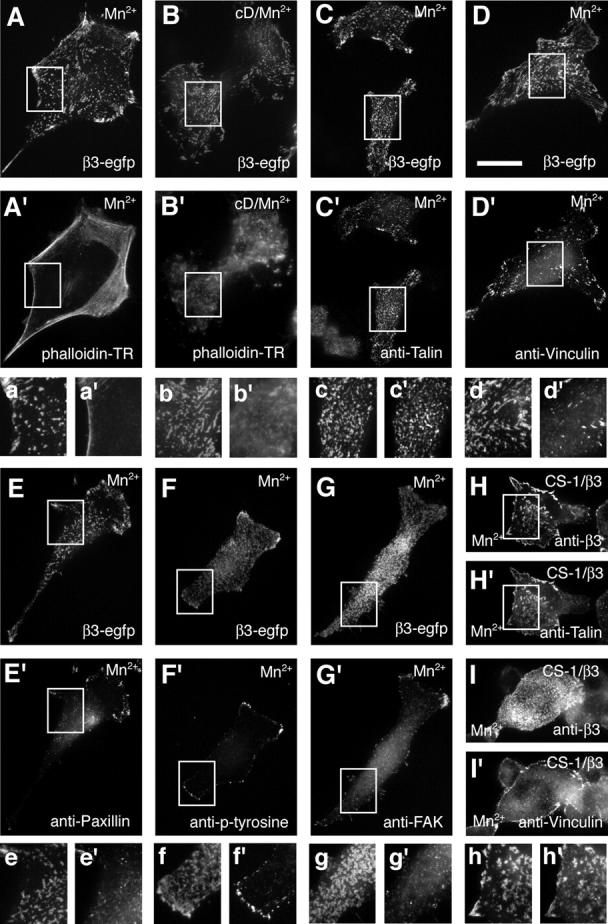
F-actin–independent integrin clustering and talin recruitment. Epifluorescence of fixed B16F1 and CS-1 cells exhibiting de novo formed β3 integrin clusters. Integrin fluorescence (A and B) and phalloidin stained F-actin (A' and B') in 0.5 mM of Mn2+-treated cells (20 min; A and A') or 10 μg/ml of cD/Mn2+-treated B16F1 cells (25 min of cD, followed by 20 min of cD/Mn2+; B and B'). Immunohistochemical analysis of focal adhesion adaptor proteins recruited to Mn2+-induced clusters of β3-EGFP integrins in B16F1 cells (C–G) and nontagged β3 integrins in CS-1 cells (H and I). Pairs of images show the distribution of the EGFP integrin fluorescence (C–G) or anti-β3 staining (H and I) and the respective immunohistochemical localization of talin (C' and H'), vinculin (D' and I'), paxillin (E'), phosphotyrosine (F'), and FAK (G'). Corresponding magnified views of the boxed areas in A–H and A'–H' are shown below each image pair (a–h and a'–h'). Bar, 25 μm.