
Figure 5.
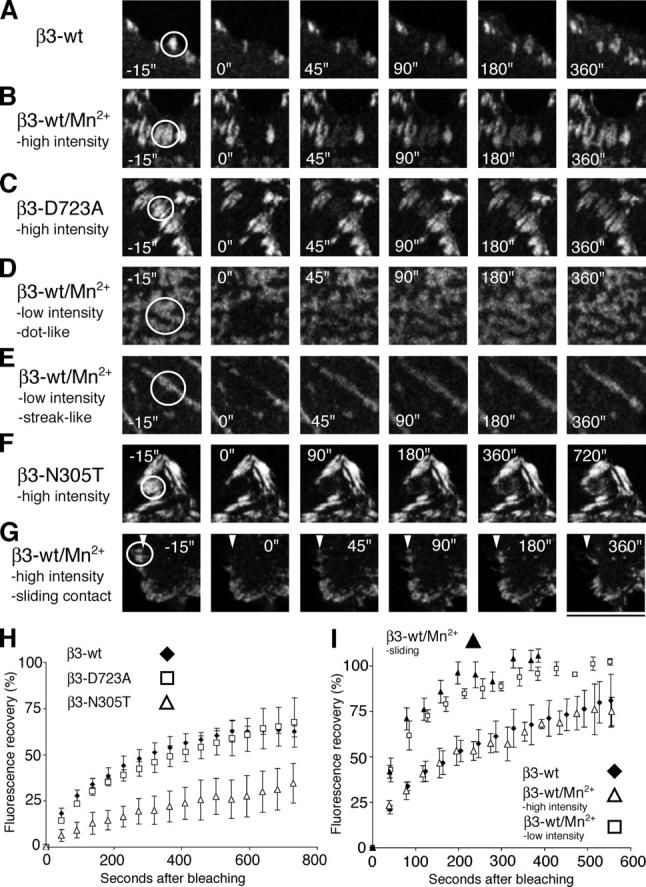
FRAP of activated integrins. FRAP analysis of β3 integrin dynamics within stationary or sliding peripheral high-intensity focal contacts and de novo formed dot- or streaklike integrin clusters in B16F1 cells. The analysis was performed in stably transfected EGFP-tagged WT (β3-wt), D723A (β3-D723A), or N305T (β3-N305T) cells. FRAP sequences of peripheral focal contacts in control cells (β3-wt; A), Mn2+-treated cells (β3-wt/Mn2+; B), and cells expressing D723A-activated β3 integrin (β3-D723A; C; Videos 1–3). FRAP sequences of de novo formed dot- (D) and streaklike (E) low-intensity integrin clusters in Mn2+-treated cells (Video 4). FRAP sequences of stationary peripheral focal contacts in cells expressing N305T-activated β3 integrin (β3-N305T; F; Video 5). Note the twofold expanded time range in F. FRAP sequence of WT β3 integrins in sliding focal contacts of Mn2+-stimulated cells (β3-wt/Mn2+; G; Video 6). Arrowheads in G indicate the position of the inner edge of the sliding contact before bleaching. (H) Comparison of the FRAP curves of peripheral focal contacts in WT (β3-wt, diamonds) or by mutationally activated β3-EGFP integrins (β3-D723A, squares; β3-N305T, open triangles), respectively. (I) Comparison of FRAP curves of control (diamonds) or Mn2+-treated (open triangles) peripheral high intensity focal contacts, as well as Mn2+-induced de novo, dotlike, low-intensity integrin clusters (squares). Superimposed on this graph is the increase in integrin fluorescence at the inner edge of bleached, inward-sliding focal contacts (filled triangles). Error bars correspond to the standard deviation of three independent experiments with each comprising at least three cells. Bars: (A–C) 7.4 μm; (D and E) 5.4 μm; (F) 8 μm; (G) 10.7 μm.