
Figure 5.
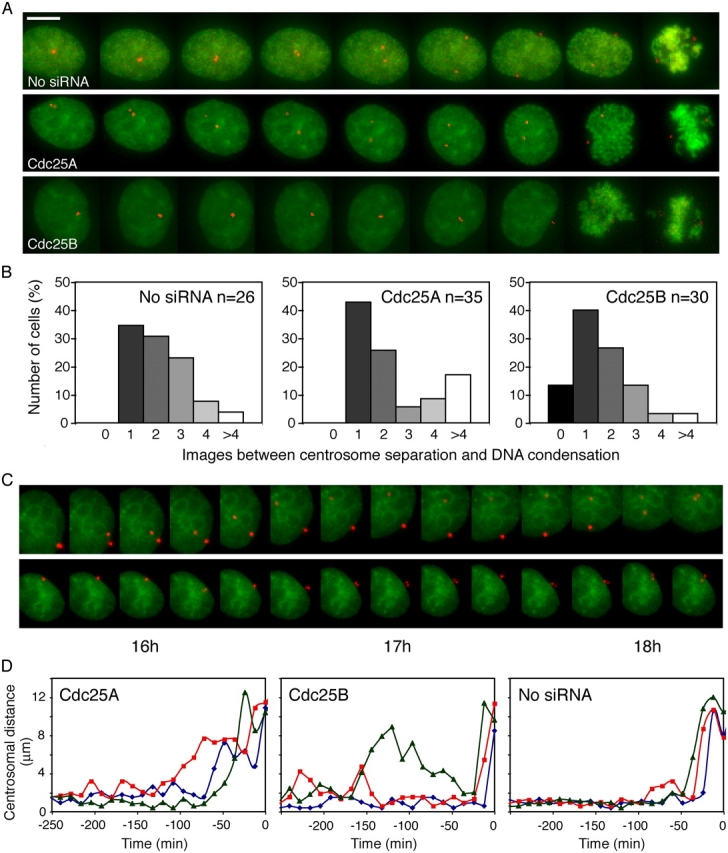
Decreased time between centrosome separation and DNA condensation in a fraction of cells injected with siRNA to Cdc25B. HeLa cells were microinjected with the marker plasmids pYFP-histone H2B and pdsRED-γ-tubulin alone or together with siRNA to Cdc25A or -B. After release from a thymidine block, injected cells were followed by 3D time-lapse microscopy. (A) Examples of the behavior of cells entering mitosis. Images show maximum intensity projections of YFP-histone H2B and dsRED-γ-tubulin fluorescence. The time between images is 12 min. (top) Normal mitotic progression of a cell injected with pYFP-histone H2B and pdsRED-γ-tubulin. (middle) Delay between centrosome separation and chromosome condensation in cell microinjected with siRNA to Cdc25A. (bottom) Less than 12 min between centrosome separation and chromosome condensation in cell injected with siRNA to Cdc25B. Bar, 10 μm. (B) Time between centrosome separation and DNA condensation in a larger number of siRNA-treated cells. The number of images between centrosome separation and DNA condensation is shown below. The distance between images is 12 min. (C) Centrosomes separate but reunite in a subset of cells injected with siRNA to Cdc25B. Example of two cells microinjected with siRNA to Cdc25B that do not enter mitosis in the time frame of the experiment. The time after release from a thymidine block is indicated below the figure. (D) Quantification of centrosome distances before entry into mitosis. Each graph presents the behavior of three single cells. The distance between centrosomes was measured in 3D and plotted against time. Time 0 is defined as first time point when DNA condensation is clearly visible.