Figure 5.

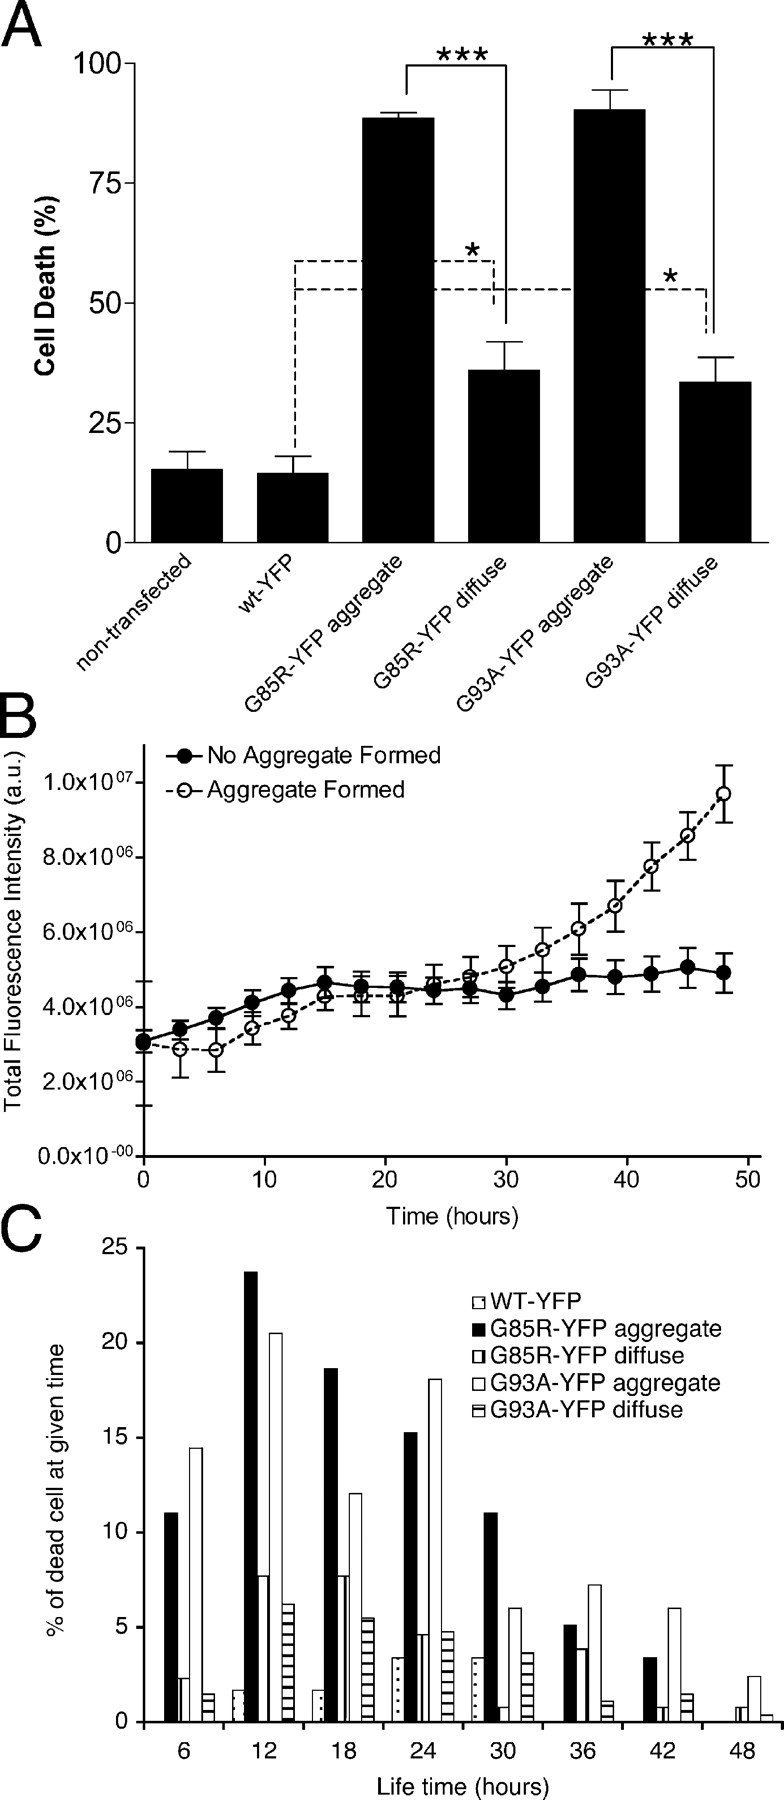
Cell death associated with mutant SOD1 aggregates. Differentiated PC12 cells were transiently transfected with constructs encoding WT-YFP, G85R-YFP, or G93A-YFP. (A) Cell death after SOD1 protein expression. Individual cells were followed for a 48-h period, from 3 to 5 d after transfection, using time-lapse fluorescence microscopy. Cell death was calculated as a percentage of dead cells at the end of the 48-h period, compared with the total number of cells. Two-tailed t test analysis (95% confidence) was used to compare the statistical difference between data sets: ***, P < 0.001; *, P < 0.05. (B) Intensity of G85R-YFP whole cell fluorescence. Whole cell fluorescence, from 3 to 5 d after transfection, was measured in PC12 cells transiently transfected with G85R-YFP. Fluorescence was measured for each time frame (every 3 h). Completed aggregate formation is set as the point of fluorescence saturation and then normalized as the 48-h time-point. n = 17 cells without aggregates and n = 21 cells with aggregates. (C) Life-time of cells after mutant SOD1 aggregate formation. Images of individual cells were taken at 2 to 3 h intervals, during the 48-h period. For cells forming visible aggregates, life-time was determined from the time when aggregates appeared (t = 0) to the time when cell death was observed. For cells that underwent cell death without the presence of visual aggregates, t = 0 was determined 3 d after transfection corresponding to a time when levels of mutant SOD1 RNA and protein levels were readily detected. Normalized life-time, t = 0 to cell death, were depicted against the percentage of dead cells at the indicated times.
