
Figure 5.
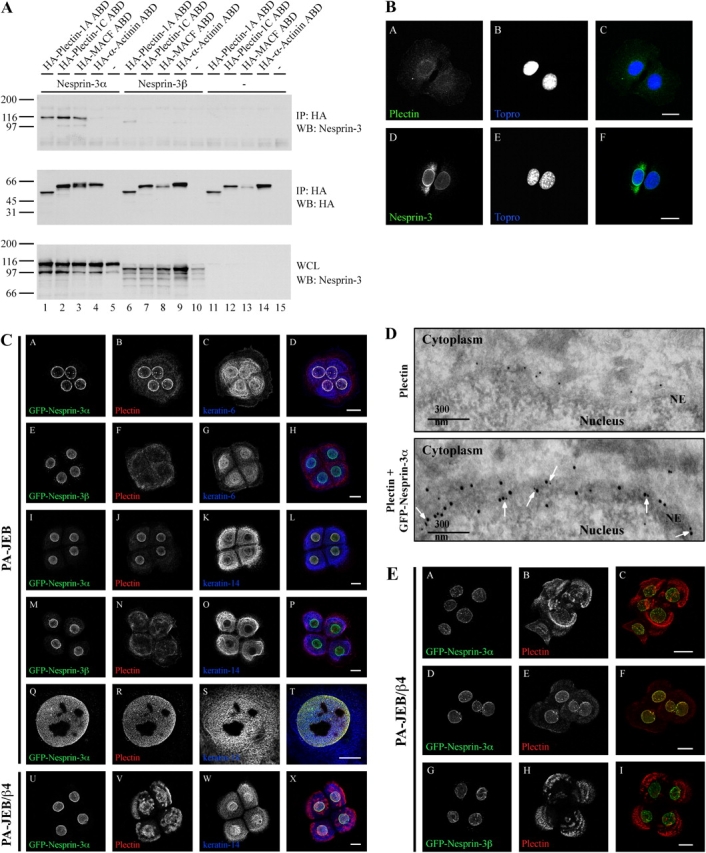
Nesprin-3α associates with plectin in cells. (A) COS7 cells were transiently transfected with either the nesprin-3α (lanes 1–5) or -3β (lanes 6–10) cDNA constructs, or a control plasmid (lanes 10–15) and expression constructs for the HA-plectin-1A ABD (lanes 1, 6, and 11), HA-plectin-1C ABD (lanes 2, 7, and 12), HA-MACF ABD (lanes 3, 8, and 13), HA-α-actinin-1 ABD (lanes 4, 9, and 14), or a control plasmid (lanes 5, 10, and 15). The cells were lysed in RIPA buffer and HA-IPs were probed for the presence of nesprin-3 (top) and the HA-tagged ABDs (middle). WCLs were probed for expression levels of the two different nesprin-3 isoforms (bottom). (B) MEF cells were stained for endogenous plectin using the mAb 121 (A) and nesprin-3 using rabbit pAbs (D). The location of the nucleus was visualized using Topro staining (B and E). C is a composite of A and B, and F is a composite of D and E. Bar, 20 μM. (C) PA-JEB (A–T) or PA-JEB/β4 (U–X) were stably transduced with retroviral constructs expressing either GFP-nesprin-3α (A–D, I–L, and Q–X) or GFP-nesprin-3β (E–H and M–P). Fluorescence studies were done to locate the GFP moiety (A, E, I, M, Q, and U), along with immunofluorescence studies of endogenous plectin (B, F, J, N, R, and V) and keratin-6 (C and G) or keratin-14 (K, O, S, and W). The far right image of each row depicts the composite image of the first three images in each row (D, H, L, P, T, and X). Four cells are shown in each image except for images Q–T, which show a higher magnification of the nucleus. All images are maximum projections. Bars: (A–P and U–X) 20 μM; (Q–T) 10 μM. (D) To determine the subcellular localization of nesprin-3 and plectin at the NE, ultrathin sections of PA-JEB cells stably expressing nesprin-3α were labeled with rabbit pAbs against the plectin-ABD (D16), followed by incubation with 10-nm gold-conjugated protein A. The sections were then fixed in 1% glutaraldehyde and reprobed with rabbit pAbs against GFP, followed by incubation with 15-nm gold-conjugated protein A. Arrows indicate areas where plectin and GFP-nesprin-3α are colocalized at the ONM (bottom). Control labeling was done in the same way, except that after plectin labeling and fixation in glutaraldehyde, the sections were reprobed with 15-nm gold-conjugated protein A only (top). Note that no labeling with 15-nm gold was seen at the NE. (E) PA-JEB/β4 cells stably expressing either GFP-nesprin-3α (A–F) or GFP-nesprin-3β (G–I) were visualized for GFP (A, D, and G) and plectin (B, E, and H). The far right image of each row depicts the composite image of the first two images in each row (C, F, and I). All images are maximum projections. Bar, 20 μM.