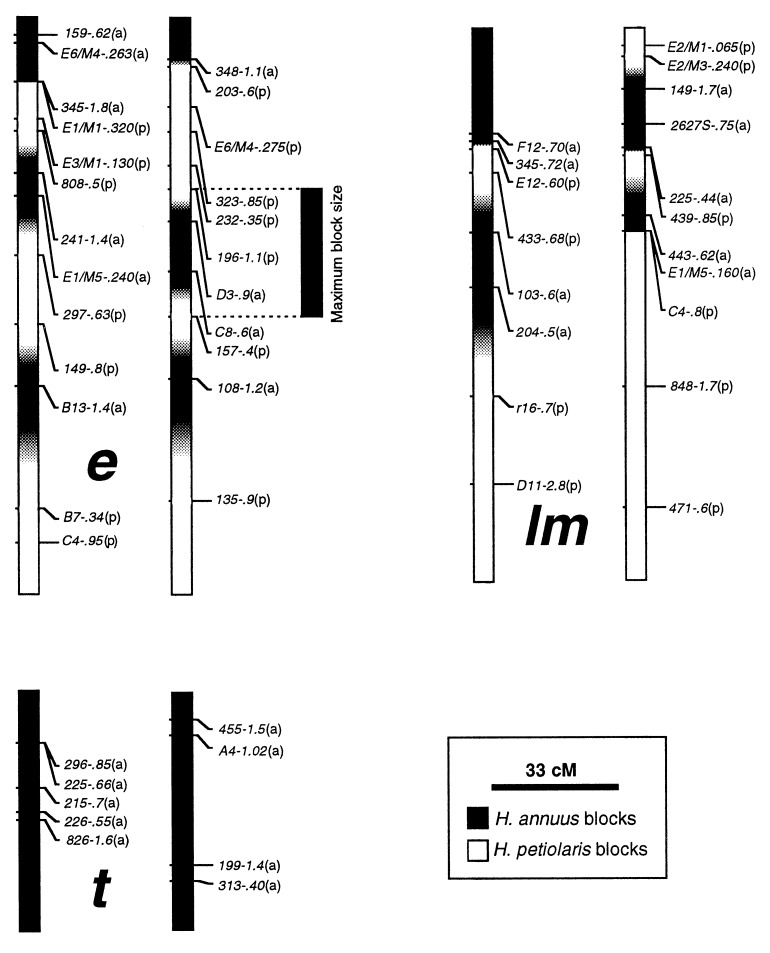
Figure 2.
Selected linkage groups of H. anomalus. Each linkage is represented by two haplotypes, which are derived from the two natural populations of H. anomalus used to generate the mapping population. Large lower case letters between haplotypes designate linkage groups (22). Marker nomenclature includes, from left to right, the primer designation and the size in kilobases of the segregating fragments scored. Letters in parentheses after each marker indicate its parental species origin: a, H. annuus; p, H. petiolaris. Parental genomic composition is indicated by black and white blocks that span the distance between consecutive markers. Regions harboring recombination sites are indicated by a gray-scale, with the intensity of shading based on the genotype of the flanking markers. Maximum block size, which was used for analytical purposes, is illustrated by the H. annuus block to the right of linkage e.

