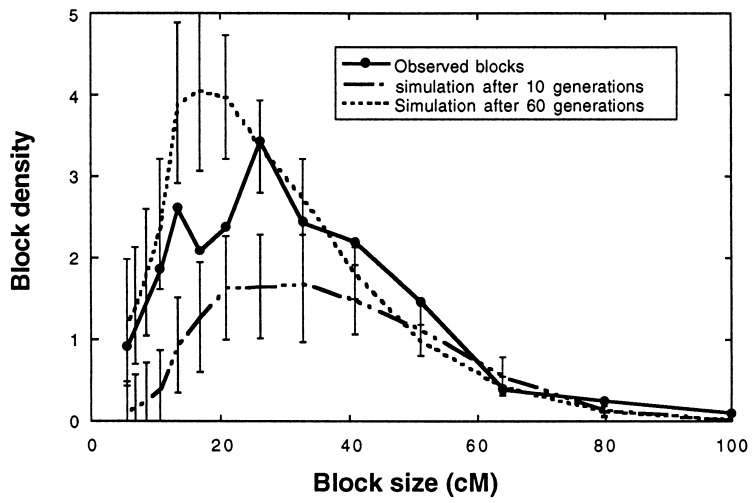
Figure 3.
Comparison of the frequency spectra (26) of maximum possible parental species block sizes in the H. anomalus genome to those of simulation populations after 10 and 60 generations of hybridization (n = 500; s = 0). The frequency spectrum shows the number of blocks in a class (block density), scaled by the size of that class (see Materials and Methods) and is the standard way of representing the distribution of block sizes (18, 34). The increase in the area under the curve over time indicates the increasing degree to which the genome is broken up by junctions. (Error bars indicate 95% confidence intervals).

