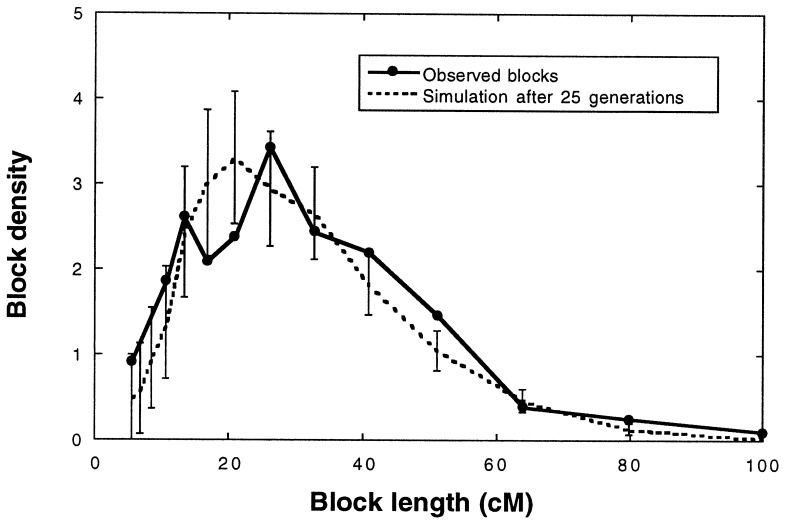
Figure 4.
Comparison of the frequency spectra of maximum possible parental species block sizes in the H. anomalus genome to those of simulation populations (cf. Fig. 3) after 25 generations of hybridization (population size = 500; selection coefficient = 0). (Error bars indicate 95% confidence intervals.)

