
Figure 6.
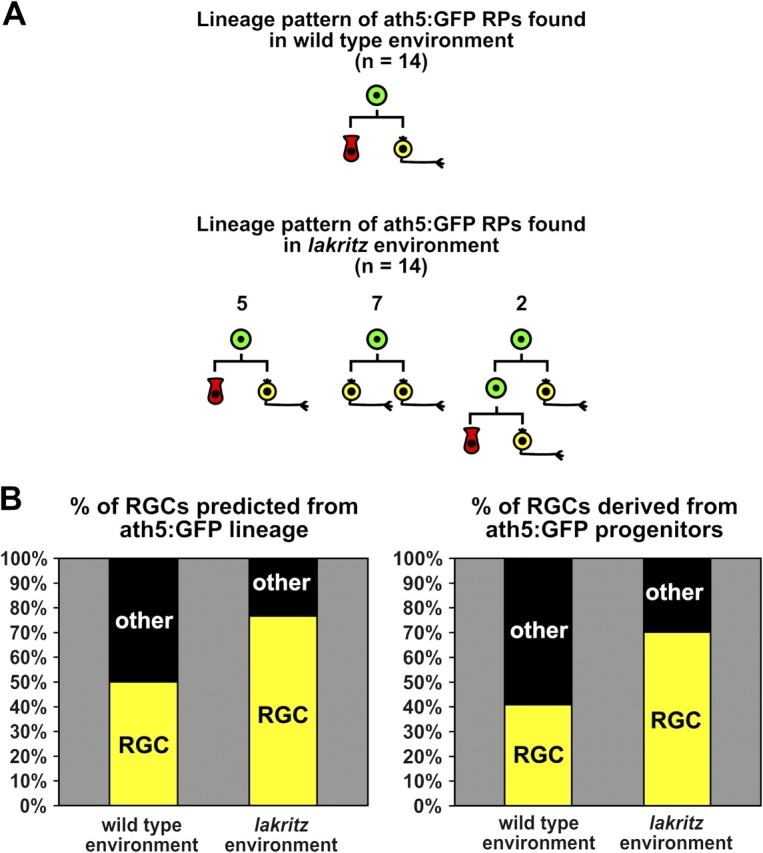
Comparisons of lineage in a wild-type and lakritz environment. (A) Summary of the lineage patterns of ath5:GFP progenitors observed in the wild-type and lakritz environment. Progenitors have been highlighted in green and RGCs in yellow. The apical cell has been highlighted in red. The fate of the apical cell can be one of a number of cell types, but our data seem to suggest that it is a photoreceptor more often than not. RP, retinal progenitor. From left to right: n = 5, 7, and 2. (B) Using these samples as indicators, one can calculate that in the wild-type environment, ∼50% of the cells generated from ath5:GFP-positive progenitors would be predicted to become RGCs, whereas in the mutant environment, 77% would become RGCs. These differences are compared with the actual percent changes in the production of RGCs from ath5:GFP progenitors transplanted to the wild-type and lakritz environments (see Fig. 4). These are significantly different at the P < 0.005 level determined by the Chi-squared test. For wild-type hosts, n = 795 in nine retinas. For lakritz hosts, n = 1,477 in 11 retinas.