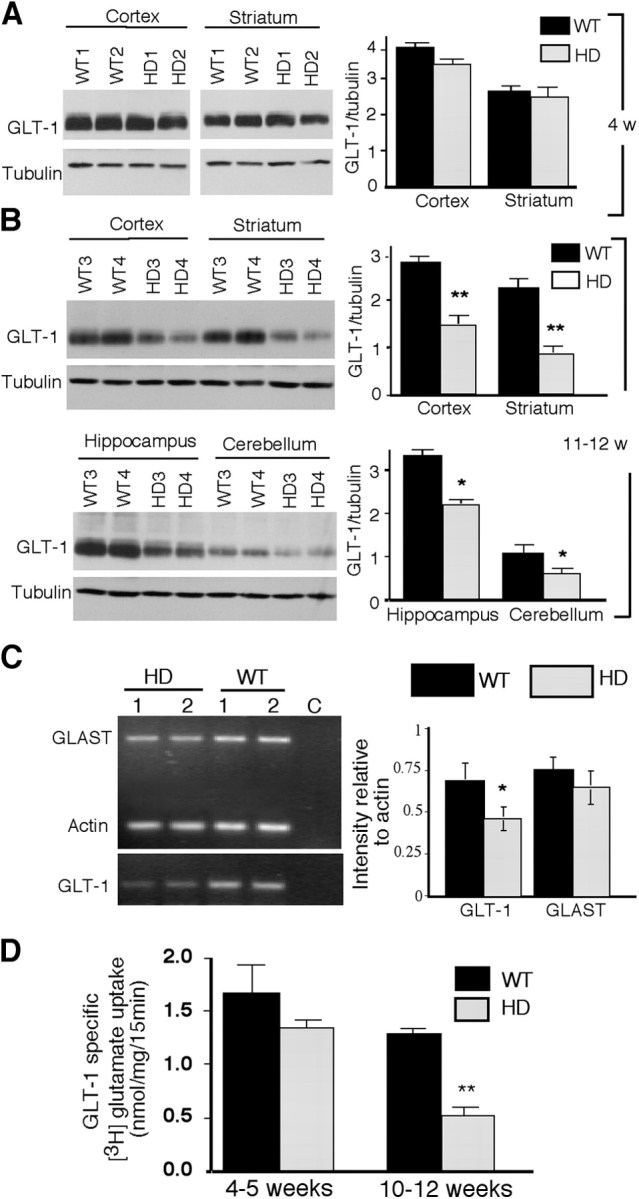
Figure 3.

Decreased expression of glutamate transporter GLT-1 and glutamate uptake in HD mouse brain. (A and B) Western blot analysis of the expression of GLT-1 in brain regions of wild-type (W1-W4) or R6/2 (HD1-HD4) mice at 4 wk (A) and 11–12 wk old (B). The same blots were probed with antibody to tubulin. The signal ratios of GLT-1 to tubulin are shown in the right. (C) RT-PCR analysis of the expression of GLT-1 and GLAST in R6/2 (HD) and wild-type (WT) mouse brain cortex. Transcripts for GLAST and actin were amplified in the same reaction (21 cycles), and the same amounts of cDNA were used for GLT-1 PCR (23 cycles). The ratios (mean ± SEM, n = 3) of GLT-1 (*, P = 0.0079, WT vs. HD) and GLAST (P = 0.11, WT vs. HD) to actin were obtained with densitometry. Panel C is the control RT-PCR without reverse transcriptase. (D) GLT-1–specific glutamate uptake in brain slices of littermate control (WT) and R6/2 (HD) mice at the age of 4–5 and 10–12 wk was obtained with DHK (1 mM) treatment. Data are presented as mean ± SEM (n = 4 each group). *, P < 0.05; **, P < 0.01 compared with WT control.
