
Figure 6.
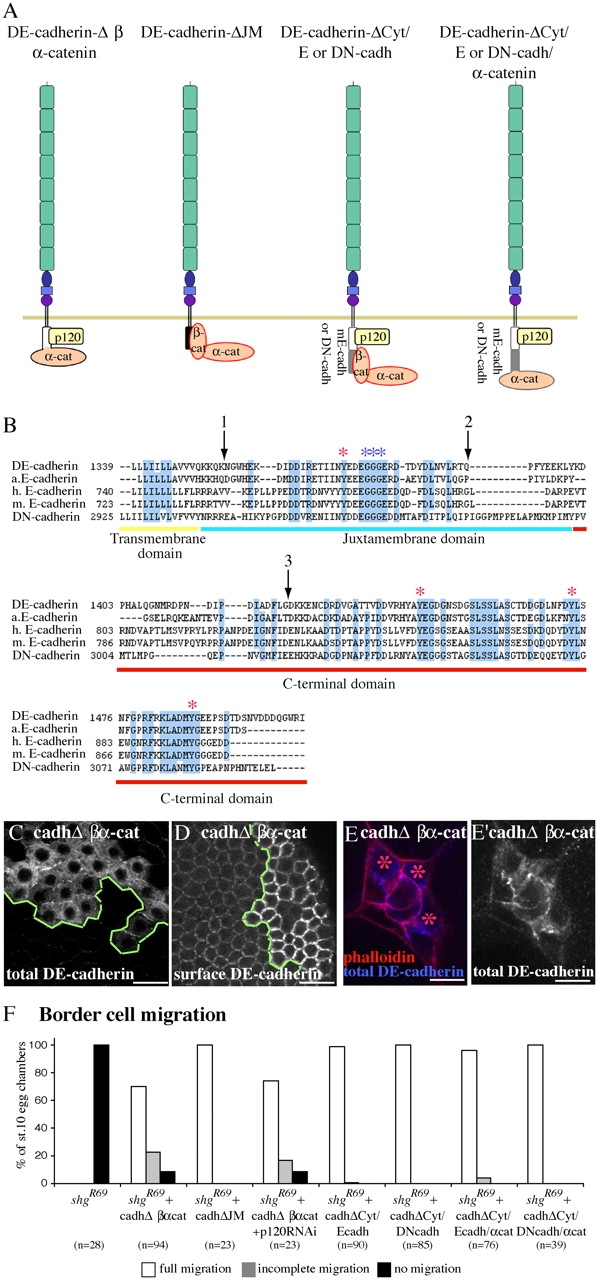
Molecular dissection of DE-cadherin cytoplasmic domain. (A) Schematic representation of proteins that were analyzed. (B) Alignment of D. melanogaster, Anopheles, human and mouse E-cadherin, and D. melanogaster N-cadherin transmembrane and cytoplasmic domains. In DE-cadherinΔCyt/α-catenin and DE-cadherinΔβ/α-catenin, α-catenin was fused at arrows 1 and 3, respectively. In DE-cadherinΔJM, the region between arrows 1 and 2 was deleted. Blue asterisks indicate p120 catenin–binding sites. Red asterisks indicate conserved tyrosines mutated in DE-cadherin–4YF. The limit between JM and COOH-terminal domain was drawn after studies on mammal E-cadherin. (C–E′) Expression of DE-cadherinΔβ/α-catenin in shg-null mutant follicle (C and D) and border cells (E). (C and D) Mutant cells are above and to the right of the green line. (E) Three border cells (asterisks) are shg mutant and express DE-cadherinΔβ/α-catenin. (C and E) All DE-cadherin is detected. (D) Only surface DE-cadherin is detected. (E) Phalloidin (red) stains F-actin and DE-cadherin is in blue. (F) Border cell migration in shg mutant border cell clones expressing the indicated UAS transgenes. Bars (C and D), 20 μm; (E and E′) 10 μm.