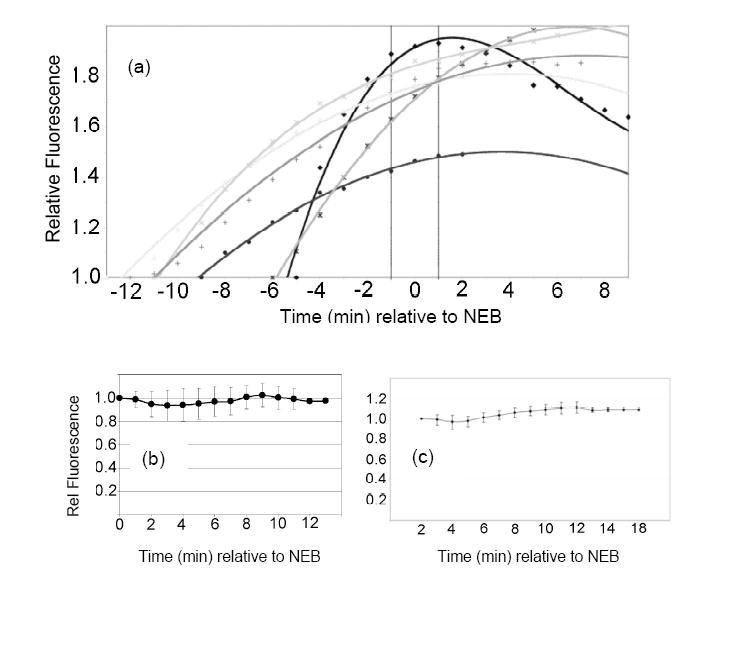
Figure 4.

(a) Time course of the phosphorylation of peptide 1 prior to NEB. The nonphosphorylatable analogue 2 and 70 kD Texas Red-dextran were simultaneously microinjected into PtK2 cells. Cells were illuminated (1 sec) during prophase (i.e. prior to NEB) to convert the inert sensor 2 to its active form 1 and the fluorescence change as a function of time recorded with respect to NEB. Each progress curve is derived from a single cell and a total of 18 cells were examined (6 of the progress curves are shown here) (b) Time course of the phosphorylation of peptide 1 after NEB. PtK2 cells were treated as in Figure 2a, except that photolysis was performed following NEB. The progress curve represents the average fluorescence change of 16 cells (each data point represents the mean ± s.d.). (c) Fluorescence change following NEB in the presence of okadaic acid (1.5 μM).
