Figure 5.

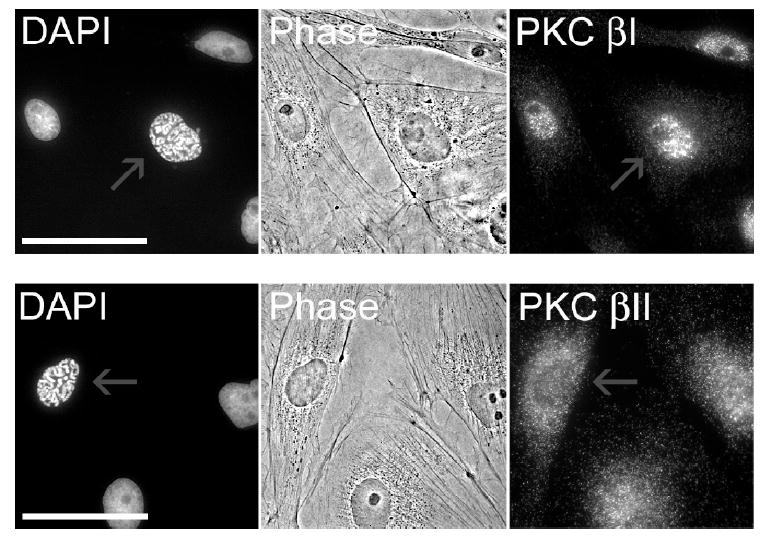
Localization of PKC ß isoforms in prophase (scale bar = 50 μm). Cells stained PKC ßI (upper panel) or PKC ßII (lower panel) antibodies and DAPI. Red arrows highlight cells in prophase. All other cells are in interphase.

Localization of PKC ß isoforms in prophase (scale bar = 50 μm). Cells stained PKC ßI (upper panel) or PKC ßII (lower panel) antibodies and DAPI. Red arrows highlight cells in prophase. All other cells are in interphase.