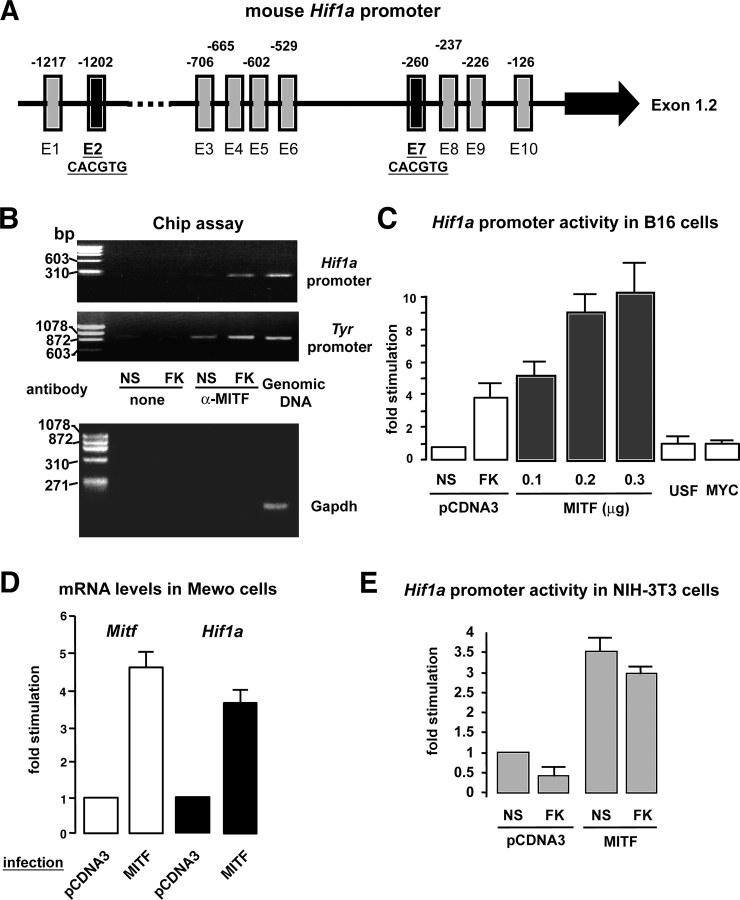
Figure 3.
MITF binds to the Hif1a promoter and induces Hif1 α gene expression. (A) Schematic representation of the Hif1a promoter. Black arrow denotes the ubiquitously expressed 1.2 exon (Wenger et al., 1998). Vertical rectangles and the associated numbers represent the several E-boxes found in this promoter fragment and their localization within the sequence. Note that E2 and E7 match perfectly with the previously described MITF binding sequence (CACGTG) (Weilbaecher et al., 1998). (B) Chromatin immunoprecipitations were performed on extracts from nonstimulated (NS) and 5-h forskolin-stimulated (FK) B16 melanoma cells as described in Materials and methods. Immunoprecipitation was performed using a specific anti-MITF antibody and primers spanning the Hif1a or the tyrosinase promoter region were used for the PCR amplification. A control of PCR amplification was performed using mouse genomic DNA, which showed a 300-bp and a 900-bp band corresponding to the amplification of the Hif1a and tyrosinase promoter regions, respectively. Another control was performed using a primer pair to the mouse GAPDH (150-bp amplicon). (C) Hif1a promoter activity after cotransfection of B16 cells with the Hif1a promoter fragment together with an empty plasmid (pcDNA3), a vector encoding MITF transcription factor, and two other constructs encoding USF and MYC. As a control of the promoter activation, cells were stimulated with forskolin (FK). Results are shown as the fold stimulation compared with the basal nonstimulated promoter activity (NS). (D) Real-time quantitative PCR analysis to detect Mitf and Hif1a mRNA levels after infection of Mewo (human melanoma cells) with either an empty adenovirus (Adeno-pCDNA3) or an adenovirus encoding MITF. (E) Hif1a promoter activity after cotransfection of NIH-3T3 fibroblasts with an empty vector (pCDNA3) or a construct encoding MITF. Cells were next stimulated (or not) (NS) with forskolin (FK) for 24 h.

