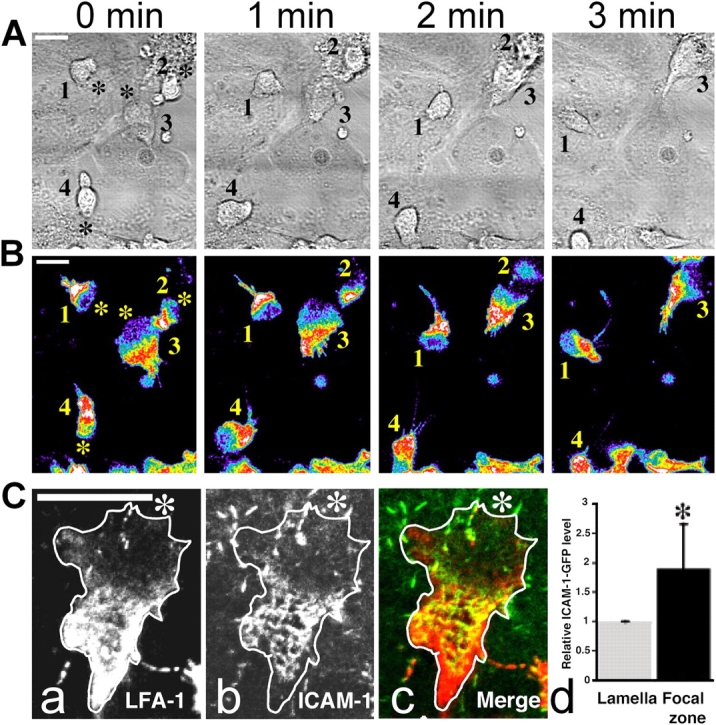
Figure 1.

Confocal image of a T cell migrating in the presence of 5 mM MgCl 2 on a target cell expressing ICAM-1. T cells labeled with Alexa 488 nonblocking anti–LFA-1 Fabs and migrating on TNF-α–activated HUVECs. (A) Phase images of the pattern of migration of four T cells (1–4) over 3 min. (B) False color images of the same four T cells showing expression levels of LFA-1 (highest [white] to lowest [blue]). The asterisk denotes the leading edge of each cell. (C) T cell (white outline) migrating on ICAM-1–transfected COS-7 cells (the asterisk denotes the T cell leading edge). (a) T cell labeled with anti–LFA-1 mAb (red). (b) COS-7 cells expressing ICAM-1-GFP (green). (c) Merge of the two images in panels a and b. Colocalization of LFA-1 and ICAM-1 can be observed in the mid-cell region. All images were taken with a 63× oil immersion objective. Bars, 10 μm. (d) Quantitation of ICAM-1 density in focal zone (black bar) compared with lamellar region (gray bar) on migrating T cells (n = 9; ±SD). *, P < 0.001.
